How to THINK STEEP in Geography, life, the universe and everything!
Guest blogger Josie Luff (@geojosie) discusses the evolution of STEEP, a great technique to encourage students to think synoptically.
I’ve been using SEEP (Social, Economic, Environmental, Political) in my Geography lessons since I started ‘formally’ teaching as an NQT 12 years ago.
I was reading through the Examiners Comments on some A level specifications for that years’ exams and noticed they were bemoaning a ‘lack of synopticity’. Being a mature student of Geography at the wonderful Open University and gaining QTS later in life, I was embarrassed to admit it was not a term I had come across before. What can ‘synopticity’ mean? And, more importantly, if I didn’t know what it meant, how would my students?
Having attended a course on ‘Teaching A-Level’ with @jmbgeog during my NQT year, I began to understand. But how could I get this across to my students and teach them to not only use and include synopticity in their Geography thinking, speaking and writing, but to see the world and ask questions about people and places outside of my classroom with their Geography hats on?
I needed my students to see the context of a place, not just the surface views offered by looking at an isolated natural hazard or a change in population structure. I needed them to see, know, understand and question the wider view of a place.
And so, SEEP was born.
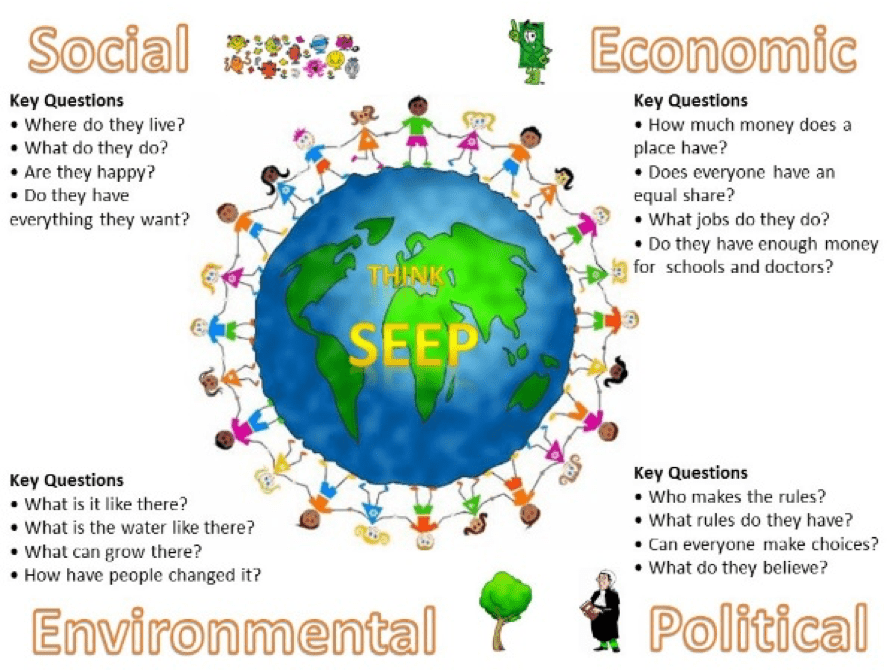
SEEP
I created a selection of questions that I wanted my students to ask about a place and then be able to answer once they had learned about it. The original questions would then hopefully lead onto them asking other questions and could be used by me to prompt them into using the specific keyword language of Geography. I then categorised these questions into Social, Economic, Environmental and Political. While Social, Economic and Environmental are relatively self-explanatory and data-rich, I decided on Political as I wanted to include the history of a place and how this history, both modern and pre-modern, impacts on a place today. Equally, Political also contains questions about rules, beliefs, traditions and cultures to enable my students to understand WHY some things can/can’t or do/don’t happen in a place and whether it is the same for everyone in that place.
As time moved on, I began to think about the use of technology in my classroom, my teaching and my student’s lives. Everyone has a phone, don’t they? The first iPhone was available in 2007. That’s the year my current Year 7’s and Year 8’s were born. They have never NOT been connected to the wider world, but they needed to understand HOW that world worked, or not.
SEEP became STEEP.
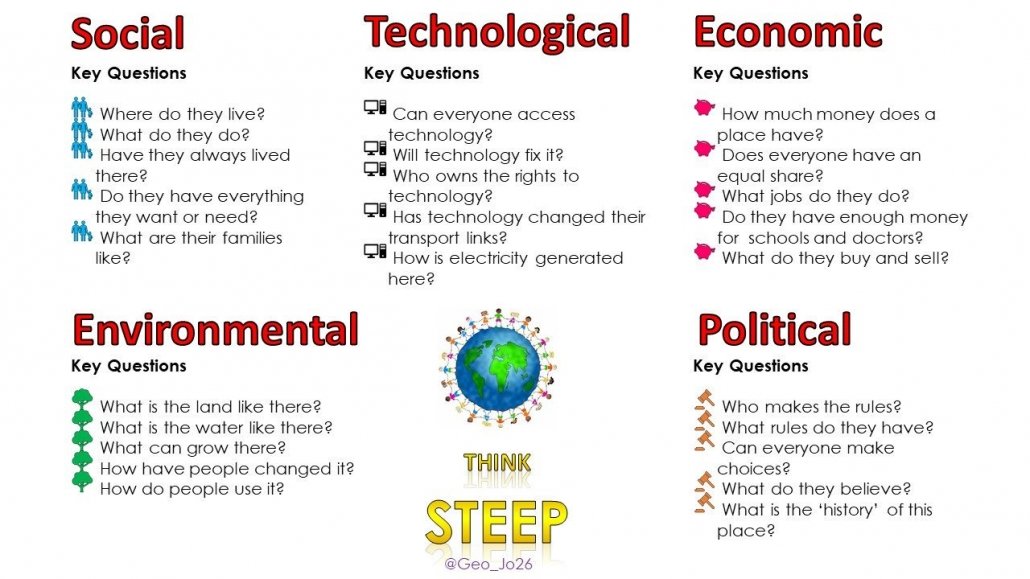
STEEP – encouraging learners to think synoptically
Each September, I begin my first lesson with STEEP and some images of an event or place that has been in the news in the past year. We start with @geography_meg wonderful CLOCC to get them looking in an atlas to find out where this place is, whether it is connected or not to other places and to find out what they might already know about it. This can take a while as they ‘discover’ things they didn’t know (including how to use the Index!). We try to work out WHAT it is like for the people that live there (sometimes getting side-tracked looking at the amazing Dollar Street website www.gapminder.org/dollar-street), but also WHY it is like this. Next, we look at the natural environment of a place, the climate, geology and the natural resources and how this has helped or hindered development and whether technology or lack of it, has made a difference to this place. We use facts and data to look at whether everyone has everything they need, socially, environmentally and economically but also investigate HOW histories, connections, beliefs, traditions, languages, and cultures have created this place to be the way it is now.
When investigating a Case Study, we collect our STEEP learning on a Case Study Sheet so we can return to it for facts, knowledge and our synoptic thinking.
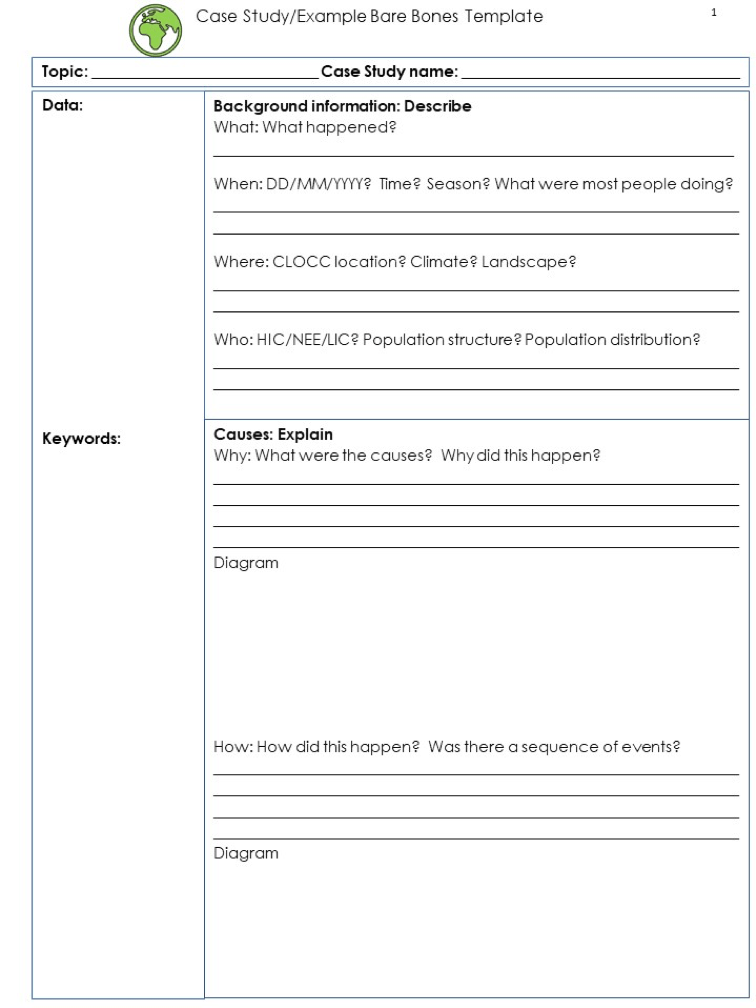
Case study bare bones template
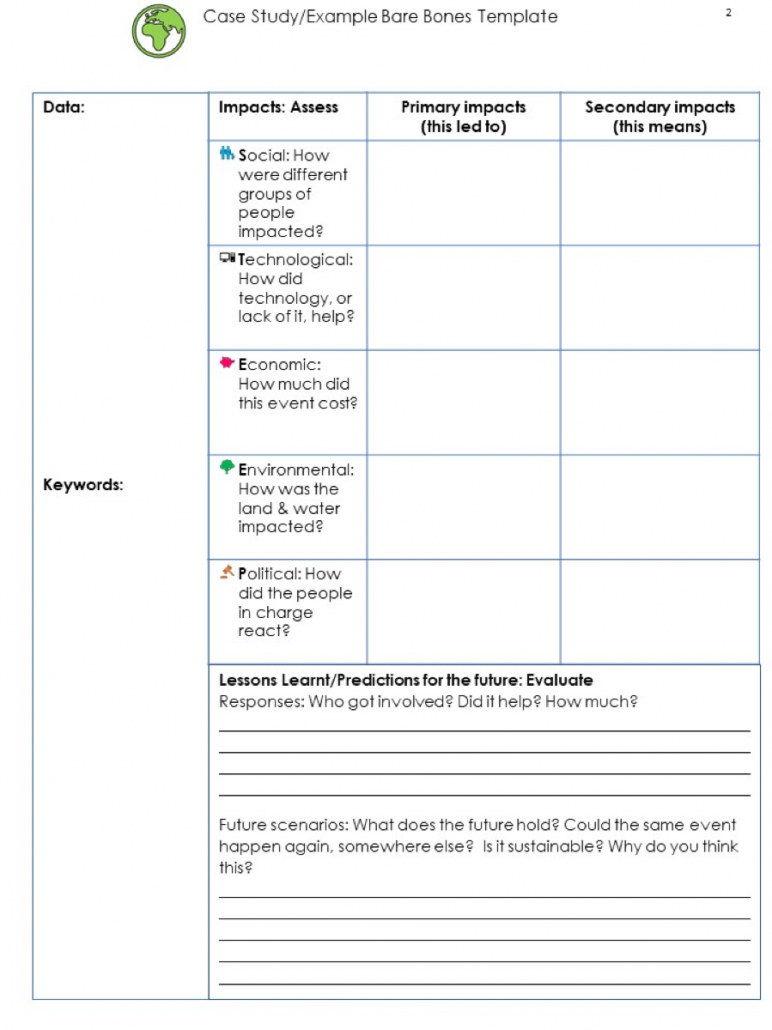
Case study bare bones template

By doing this, I’ve found my students have a much wider view of the world and that to truly be an #ExcellentGeogapher they need to know I will not accept ‘because it’s hot’ as a good enough answer!
We investigate the world, it’s people and places, synoptically!
Josie Luff
August 2019
Internet Geography is offering a platform for guest bloggers for this academic year. Got a teaching strategy, interest or anything geographical you’d like to share? Please contact us. We’re unable to offer a financial award but we’ll send you a little treat in the post.