Measuring Air Pollution – A Simple Fieldwork Experiment

In this guest blog post Dr Paul Ganderton provides guidance on completing fieldwork involving measuring air pollution. You can follow Paul on Twitter via @ecogeog.  

Fieldwork should be frequent and compulsory! There, said it! Against the mounting paperwork and issues in my system, I stand for practical work for all students as often as possible. However, we do need to be aware of the real constraints in this endeavour. As much as we’d like to spend every lesson out in the field (and imagine how much they’d learn!), we need to allow other subjects their time. Cash is a real issue as well. I’m guessing no-one’s funding has expanded to keep pace with the cost of fieldwork equipment. This is why I’ve developed a series of field experiments that are simple, cheap and effective.

Let’s get started. These are the key factors to I bear in mind at the planning stage:

  • Validity – will the fieldwork give me decent data that can be seen (albeit in more sophisticated forms) in real geographical science?;
  • Complexity – if the work is done remotely by students, can the instructions be unambiguous so the whole class can be confident everyone’s data are comparable?;
  • Timescale – can the work be set up reasonably quickly and get decent results so students keep their enthusiasm? I like the idea of thinking fast and slow and cooking fast and slow, so why not Geography fast and slow! This one’s fast; a week’s trip gives me slow! (Both are valid but I love the quick experiment. It motivates students, gets them to realize that Geography is mostly a practical science);
  • Cost – yes, I’d love the latest monitoring equipment (please) but in the real world, you don’t get the luxury and it’s crucial all students take part.

Putting this piece of fieldwork in context of these three ideas:

  • This follows accurately the methods used in air pollution research. Today, remote sensors are used but the basic idea of gathering point data is very much alive;
  • This experiment has been road tested loads of times. I’ve never had a student fail. I even demonstrate in class first and get them to trial setting up a unit;
  • I plan this to last for about 7 days. So, students go home on holiday/half-term, set this up, forget it and bring the materials in at the start of the new term. Total student time – about 1 hour tops. About 3 lessons in class – 1 before to outline the experiment; 2 for analysis and discussion afterwards;
  • Cost – borrowing from your science department and a couple of household items means your main cost is just 1 stake per student (woodwork department scrap or hardware store). Depending on your jurisdiction, about 1GBP/$2 all up.

Moving on to the fieldwork stuff:

  • Equipment – for each student: 1 stake 1.5m high, ideally 20x20mm square; 4 microscope slides; enough sticky tape to bind top and bottom of the slide to the post; petroleum jelly to smear on each slide. For the analysis, an identification guide and microscope.
  • Method:
    • Take the stake and tape one slide to one of the faces. Make sure that only about 1cm is covered top and bottom of the slide so there’s enough space for the jelly;
    • Repeat for the other 3 faces. It’s important that the slides are all at the top of the stake. I’ve had students tape all four on at once. It’s not hard. If slides are glass, a quick warning about wearing gloves or taking care might be useful. Label each slide as N, S, E or W;
    • On the exposed glass (not tape), smear petroleum jelly on the slide. How much? More than a smear, less than a big splodge – I suppose 0.25mm – it needs to be able to withstand a week’s weather;
    • Find a spot to locate the stake. The obvious choice is in the garden, away from objects that impede air flow. Some students might live in apartments so they may have only a balcony or even just a window. No problems, just adjust as needed and use this as a case study in discussing sampling arrangements! Make sure the stake is oriented so the North-facing slide faces North etc.
    • Leave alone for about 7 days if possible;
    • At the end, take the slides carefully off the stake avoiding smudging the jelly. Transport the slides to school so that they are not smeared. I find taping them to a piece of cardboard is good. A lunch box where the slides are stuck to the bottom is excellent. Discuss with students how to transport their data without ruining it!
  • Analysis:
    • If the work has gone well, you should have 4 slides with a variety of particles embedded in them. From this point, there are two main questions – what are the particles and how many are there?;
    • For the former, there are usually only 5 common particles: pollen, dust, fibres, fly ash, diesel carbon and grit. Give students an identification guide and a microscope and get them to see how many different categories of particle they can recognize(1). Put this in a table/spreadsheet;
    • For the latter, there needs to be some common system. It’s possible to count but would take far too long and be likely erroneous (bored students!). A simpler scale is the Likert-type Scale: Absent, Rare, Uncommon, Common, Abundant. Add these labels to the table/spreadsheet;
    • Take each slide in turn. Analyse the types of particles and their abundance. Put the data in the table and repeat until slides have been recorded;
    • Record the location of each stake on a map (paper or electronic).
  • Discussion:

At this stage, you should have 4 readings for each stake and a map detailing locations. This is the pattern – the whatand where. Now we get students to find out why. At this point, you can go in any number of directions which is what makes this such a good piece of fieldwork! Here are just a few of the questions I’ve posed over the years (with suggestions for answers/discussions):

  • Which direction has the most particles? (prevailing winds?)
  • Which particles are most common? (pollen, suggesting countryside or diesel carbon, suggesting roads?)
  • Are particles equally common on all sides or just some? (group of trees on one side?)
  • Do particle counts vary in one direction (distance from roads or quarries/forests etc.?)
  • Which of these particles causes most impact to (a) the environment (e.g. dust covering plants affecting photosynthesis); and (b) people (poor air quality links to asthma etc.). Get students to research this as a part of their study.
  • Taking it further:

The advantage of this work is that you can take it in a number of equally valid directions:

  • Critique of method – is it realistic and likely to give decent results?;
  • What factors might make the results less valid?;
  • What is the sampling method and how might it be improved?;
  • What pollutant factors are most important in our towns and cities? Is this research equally useful in other towns/nations? Why/why not?;
  • What can be done to reduce air pollution in our town?
  • What are the 3 key takeaway points that you have learned? Why did you choose those 3?
  • Carry out simple statistical/graphical techniques to allow comparison between sites. What pattern is shown and how can we account for it?
  • Air pollution and public health is a huge study area. Students can study the impact of exhaust fumes on health and mental development, explore the issues surrounding Lead in petrol, look at exposure to pollutants on child development etc.

There we have it. A simple yet effective fieldwork item that could be used for different years/topics. It yields itself to so much analysis and interpretation. It develops citizenship and personal health ideas through appreciating the pollution level around us. Given that a bit of promotion never hurt any subject, it can be said that this approach to a topic allows you to develop an appreciation of Geography and its potential in the real world.

Dr Paul Ganderton
@ecogeog

Footnotes

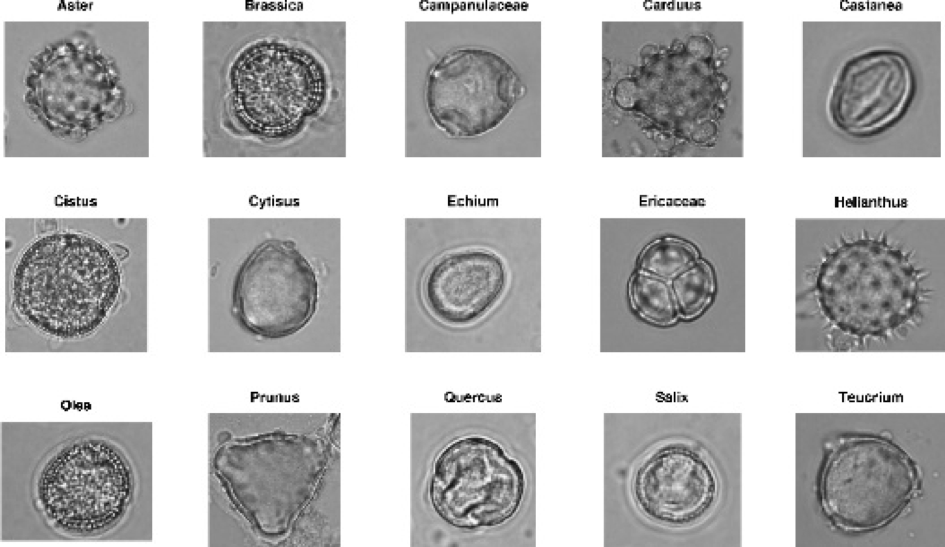
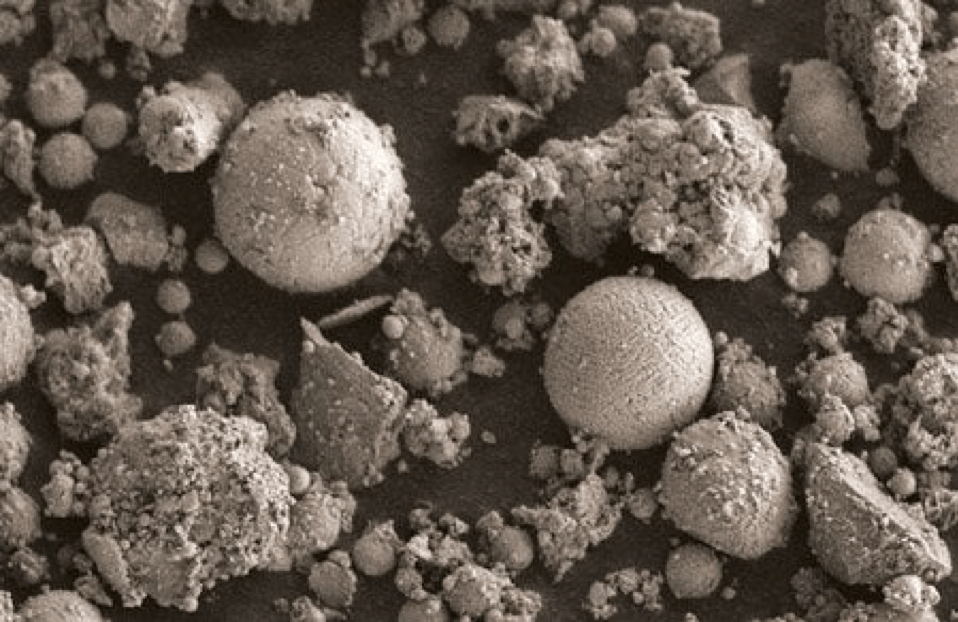
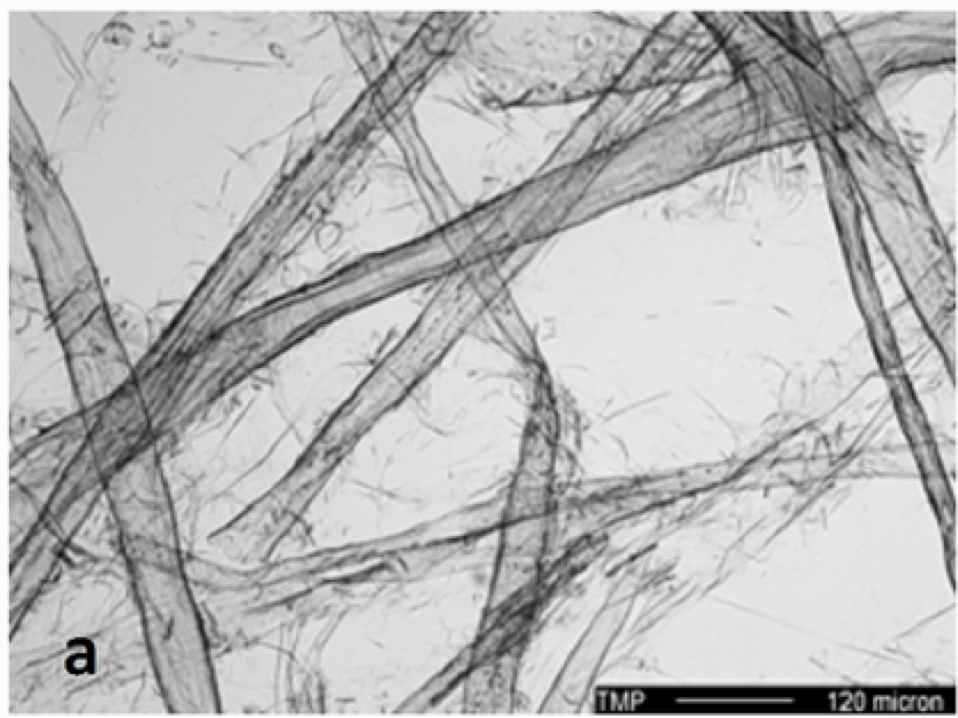
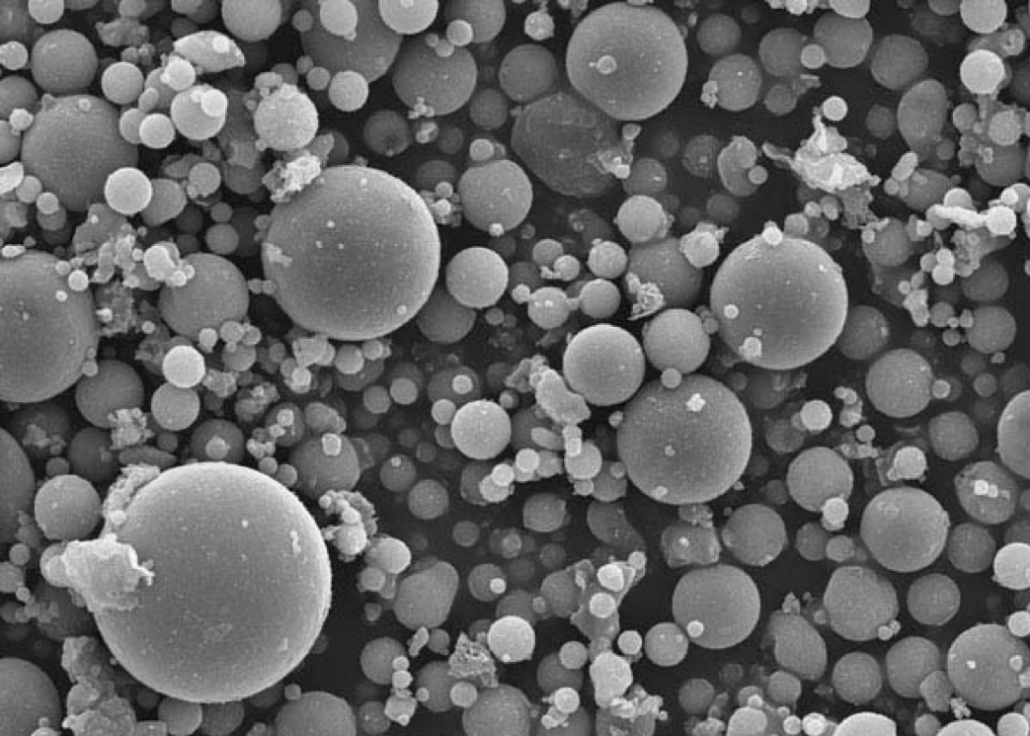
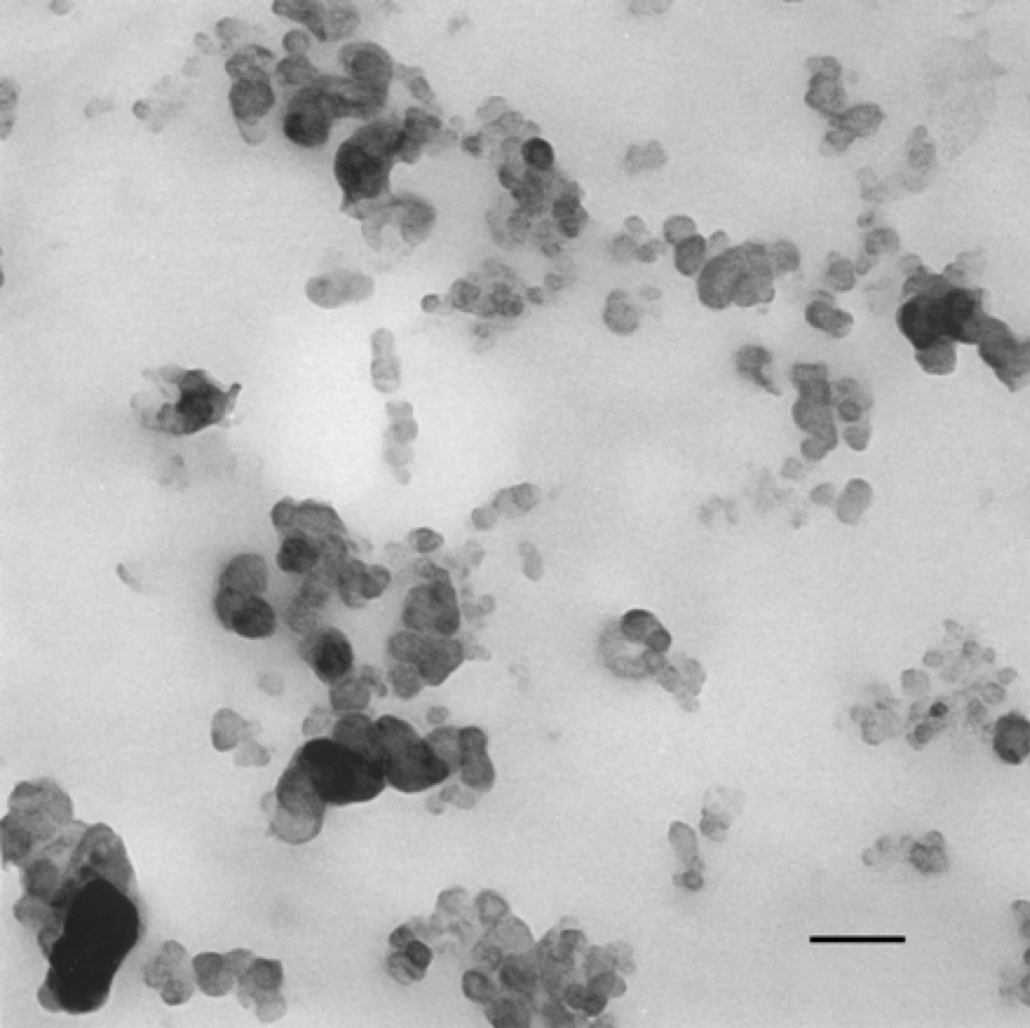
  • Particle Identification. It’s easy to make a chart from Google images as was done for this blogpost. Here are some images to help you differentiate:

Pollen:

Pollen

Dust:

Dust

Fibres:

Fibres

Fly ash:

Fly Ash

Diesel/engine particles:

Diesel/engine particle

Grit:

Grit

AQA GCSE Geography The Living World Work Booklet

We recently ran a poll on Facebook and Twitter to find out what Internet Geography Plus subscribers wanted adding to the subscription area. Fifty-four per cent of Twitter respondents wanted to see the development of work booklets as did the majority of Facebookers. As a result of this, we are pleased to launch the first Internet Geography Plus work booklet!

Our first, fully editable work booklet covers ecosystems and tropical rainforests as part of the AQA GCSE Geography Living World unit (hot and cold environments will be published separately). The booklet can be used during class teaching, as a catch-up resource for students who missed the unit or as an opportunity to re-visit learning throughout the course, either in class or for homework.

Not only does the booklet include activities it also contains:

  • QR codes linking to online resources to support learners
  • links to online quizzes so students can check their learning
  • space for students to complete dual coding at the end of each section to summarise their learning, along with online resources to support learners complete this

Booklets covering each unit of the AQA GCSE Geography course will be added this term and are free to Internet Geography Plus subscribers. Log in to download the booklet now. Not a member? You can take out a low-cost subscription here.

UPDATE – 10/11/2019

We’ve uploaded a large number of work booklets for AQA and Edexcel A GCSE. For AQA these include:

  • The Changing Economic World
  • The Challenge of Natural Hazards – Climate change
  • The Challenge of Natural Hazards – Tectonics
  • River Landscapes in the UK
  • Coastal Landscapes in the UK
  • Ecosystems and rainforests
  • Ecosystems – cold environments
  • Ecosystems – hot deserts

For Edexcel A you can download:

  • Global Development
  • Weather Hazards and Climate Change
  • Ecosystems, Biodiversity and Management (the deciduous forest)
  • Ecosystems, Biodiversity and Management (the UK and The tropical forest)
  • River landscapes and processes
  • Coastal landscapes and processes


Just a note of thanks for all of your hard work with this website. It is a fantastic set of resources and our students are benefiting greatly from them. I subscribed earlier this year and now the department has done which is good for us all. It is fantastic value for money and the materials have been welcomed by teachers, pupils and parents. It is good to know that it is a site you can trust to be AQA specific and kept so up to date.

Nik G September 2019

Countries of South America Quiz

Have you got what it takes to beat our South American countries quiz?

0%

Identify the South American country labelled 1.

Internet Geography
Correct! Wrong!

Identify the South American country labelled 2.

Internet Geography
Correct! Wrong!

Identify the South American country labelled 3.

Internet Geography
Correct! Wrong!

Identify the South American country labelled 4.

Internet Geography
Correct! Wrong!

Identify the South American country labelled 5.

Internet Geography
Correct! Wrong!

Identify the South American country labelled 6.

Internet Geography
Correct! Wrong!

Identify the South American country labelled 7.

Internet Geography
Correct! Wrong!

Identify the South American country labelled 8.

Internet Geography
Correct! Wrong!

Identify the South American country labelled 9.

Internet Geography
Correct! Wrong!

Identify the South American country labelled 10.

Internet Geography
Correct! Wrong!

Identify the South American country labelled 11.

Internet Geography
Correct! Wrong!

Identify the South American country labelled 12.

Internet Geography
Correct! Wrong!

Identify the South American country labelled 13.

Correct! Wrong!

Countries of South America
Are you a history teacher?

You've had a nightmare. Put an atlas on your Christmas list.
Must try harder!

A disappointing performance. Put an atlas on your Christmas list.
Not bad!

Not a bad effort, you're no history teacher!
Legend

Well done, impressive result! You're clearly a geographer!

Share your Results:

Biome App Worksheet

Recently, Nicole Craig (@NLCGeog) shared a resource on Twitter that has proven to be very popular!

Nicole has kindly made the resource available to download on Internet Geography. Also attached to the resource is the information slide Nicole displays on the board for students and the information sheets they use to write their definitions in their own words.


Don’t forget to give Nicole a follow on Twitter. Please show your appreciation in the comments below or by contacting Nicole on Twitter She is keen to know if you use it for any other topics or have any suggestions for amendments or improvements.


Free Geography Infographic

Over the past few months, we’ve been developing a range of infographics covering common case studies in geography. The infographics provide a summary overview of the main features of each case study and are available as A3 PDFs and resizable .png graphics. The infographics can be printed for wall displays, collated into revision booklets and sent home with students to decorate their bedroom walls for revision.

Infographics often prove so effective in educational contexts because they use imagery to highlight, explain, or enhance text-based information. They have the unique ability to capture attention, convey information, and encourage data retention despite their complex nature.

Our eight sets of geography infographics are available for free to Internet Geography Plus subscribers or can be purchased from our online shop.

Following a recent request from an Internet Geography Plus subscriber, we’ve just created an infographic covering Hurricane Matthew. We’ve made this available to download for free below.

Download Hurricane Matthew PDF

Hurricane Matthew .png Image

If you’re an Internet Geography Plus subscriber and have an infographic request please contact us.

Year 6 Parent Evening Ideas

Becoming a UN Climate Change Accredited Teacher

Guest blogger Glynnis Morgan (@geographygem) discusses becoming a UN Climate Change Accredited Teacher.

If you are a Geography teacher on Twitter, you may have noticed over the summer holidays a spate of teachers proudly showing off certificates from various courses, and after several posts in this vain, a circular blue badge announcing themselves as a UN Climate Change Accredited Teacher.

First UN Climate Change Accredited Teacher Certificate

First UN Climate Change Accredited Teacher Certificate

So what’s this all about?

The eduCCate Global Project has been organised by Harwood Education who have teamed up with the United Nations Institute for Training and Research (UNITAR) to “develop and deliver an innovative Climate Change Education Programme for primary and secondary schools in the UK” (Harwood Education 2019) Their mission is to ensure that there is a Climate Change Teacher, accredited by the UN Climate Change Learn Partnership, in every school around the world.


Once you have signed up to partake in the training, you need to work through 5 key courses and modules:

  • “Climate Change International Legal Regime”
  • “Human Health and Climate Change”
  • “Cities and Climate Change”
  • “Children and Climate Change “
  • “Open Online Course on Gender and Environment” (You only need to complete Module 1 from this course).

Each is a self-taught, self-paced course with a downloadable PowerPoint and PDF to accompany an interactive lesson. All you need to do is find a quiet place to sit down and work through them.

Being the Geography teacher stereotype I am, I armed myself with a pad of paper and my pencil case of coloured pens and highlighted and I took very colourful, highlighted notes. You don’t have to do this, but I found taking notes an easier way to take all the information need and gave me a point of reference for later use. I also set up a YouTube playlist to save all the fantastic videos in.

Once you have completed each course, advised to take around 2 hours, but I found it took longer as I made notes and viewed some of the extra supplementary material, you need to take the relevant quiz.


You get 3 attempts at the quiz, and you need to get 70% to pass. For the “Climate Change International Legal Regime” it works a little differently, there are 3 sections and each section has its own quiz, needing 60% to pass in 2 attempts. For each section, you receive a badge. Get all 3 badges, get the certificate for the module.

Once you have completed and passed the 5 required courses, you receive the final badge and become a UN Climate Change Accredited teacher. You then need to register this with eduCCate Global who will then add you to the world map of Climate Change Teachers.

UN Climate Change Accredited Teachers Map

UN Climate Change Accredited Teachers Map

But what’s the point in doing this?

Yes, it appeals to the competitive spirit in us, wanting to complete the courses and make an announcement that we too now have this accreditation. And of course, as professionals, we should be striving for further development of our subject knowledge for our own (and our students’) betterment.

But the main point of doing this is because climate change is the biggest social, economic, political and environmental concern of our time. Nothing else threatens our every day and our future as much as climate change and it impacts, and we need to be informed.

Back in March 2019, 4 students from a school in Oxford campaigned for better teaching on Climate Change. They launched a petition, which reached more than 50,000 signatures, stating that pupils need to be taught more about the impact of climate change. In response, the government said that the subject of climate change is already covered in science and geography (BBC 2019)

The Government’s response is correct. The Geography Curriculum refers to climate change, not only in its own individual topic of causes, impacts and responses but in many others as well, migration, energy security, food and water security, ecosystems, urbanisation and globalisation to name a few.

This qualification will add another string to many Geography teachers’ bows, and as the eduCCate Global website says, “transform knowledge into positive action”.

By providing relevant and up-to-date information on climate change, Geography teachers can make their lessons more informed than ever before. We can provide our students with the knowledge they need to help combat the impacts of climate change and lead a fundamental shift in the way we use and consume resources, travel, and treat the planet.

So if you are interested, you have until September 30th2019 to complete the courses before Phase 1 comes to an end.

Those of us signed up and accredited move into Phase 2 are excited and ready to take part!

Sign up here: https://educcateglobal.org/index.html

Glynnis Morgan
Head of Geography, south west London

@geographygem

Links:

BBC (2019) https://www.bbc.co.uk/news/av/uk-england-oxfordshire-47709552/climate-change-petition-oxford-students-campaign-for-better-teaching-on-subject

Harwood Education https://harwoodeducation.com/un-cclearn/