Ten Golden Rules for Tree-Planting

Scientists have proposed ten golden rules for tree-planting, which they believe is a top priority for all nations this decade.

Experts from the Royal Botanic Gardens, Kew say that planting trees is a brilliant solution to tackling climate change and protecting biodiversity; however, the wrong tree in the wrong place can cause more harm than good.

Forests are essential to life on Earth. Not only do they provide habitats to three-quarters of the world’s plants and animals, but they also offer food, fuels and medicines as well as soaking up carbon.

However, forests are disappearing at an alarming rate. An area of pristine tropical rainforest the size of Denmark is lost every year.

Reforestation, the restoration of forests that have recently been lost, could protect biodiversity and help fight global climate change by removing huge amounts of carbon dioxide from the atmosphere. There is a range of ambitious tree-planting projects happening around the world to replace lost forests.

The UK Government aims to plant 30,000 hectares (300 sq km) of new forest every year by the end of this parliament.

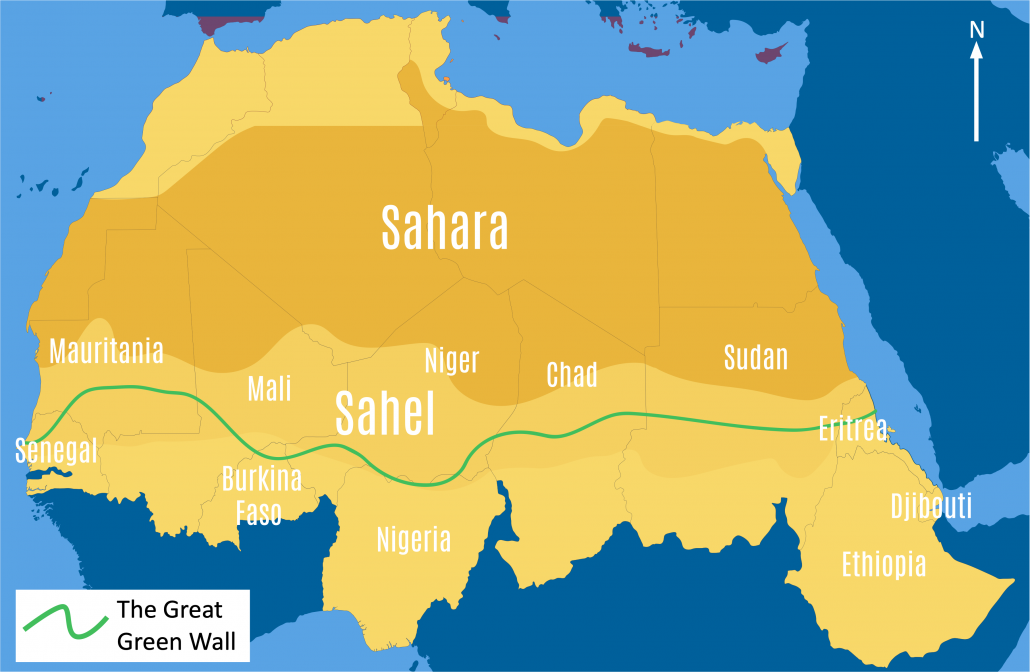
There is an ambitious project in Africa to grow a green wall of trees spanning 5000 miles (8,048km) across the entire continent, from east to west. The project, which will become the largest living structure on Earth, will help fight the climate crisis and combat desertification.

The Great Green Wall

Planting trees is an essential solution to protecting biodiversity and combatting climate change. However, the process is surprisingly complex. The right trees have to be planted in the right place, if not it can cause more damage than food.

Natural forests, containing a wide range of plants, animals, and fungi, are often replaced by commercial plantations where trees are harvested after a few decades. Afforestation is more effective when people try to recreate forests similar to natural forests and provide benefits to people, the environment and nature, and capturing carbon.

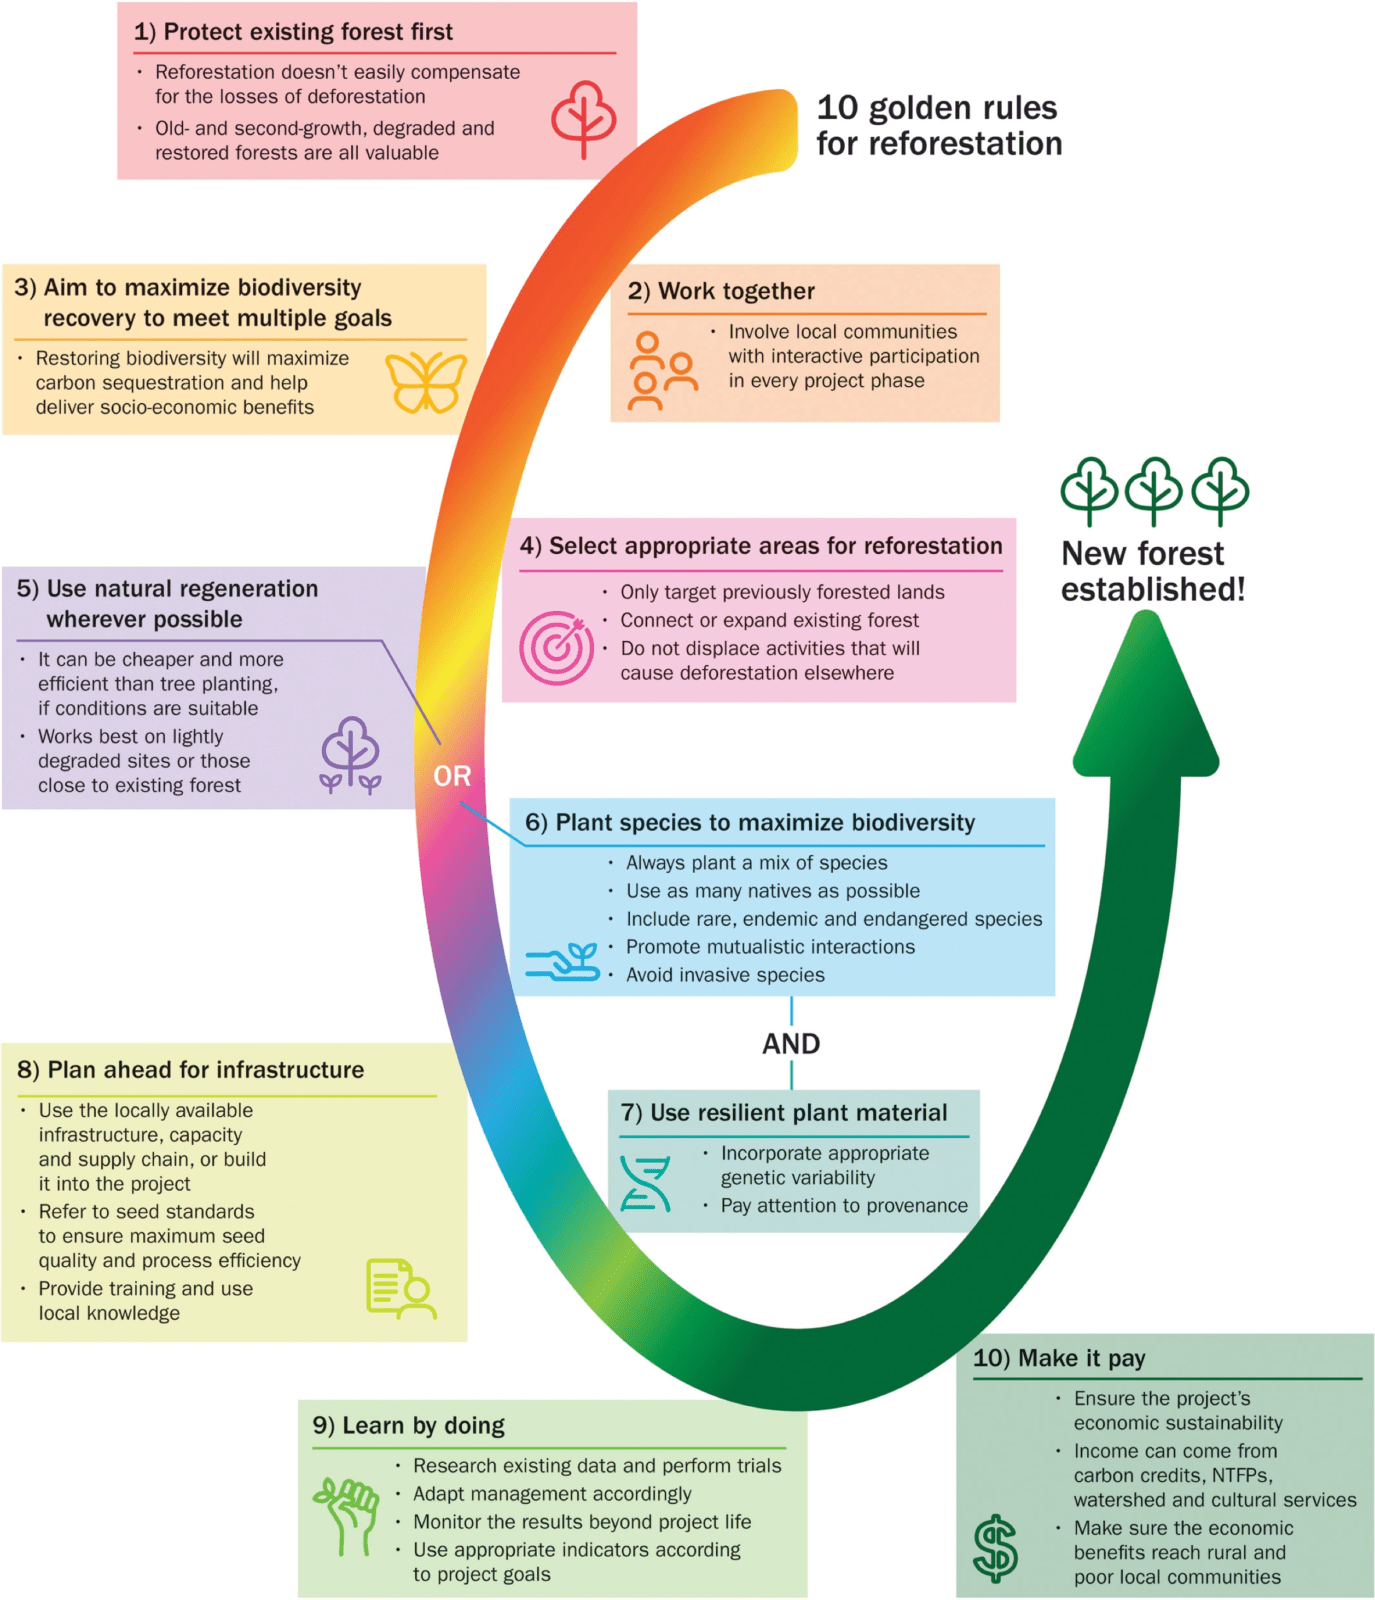
A recent review led by Kew scientists and Botanic Gardens Conservation International (BGCI) proposes ‘ten golden rules for reforestation’ to boost benefits for people and the planet. The rules are:

  1. Protect existing forest first
  2. Work with local people
  3. Maximise biodiversity recovery to meet multiple goals
  4. Select the right area for reforestation
  5. Use natural forest regrowth wherever possible
  6. Select the right tree species that can maximise biodiversity
  7. Make sure the trees are resilient to adapt to a changing climate
  8. Plan ahead
  9. Learn by doing
  10. Make it pay

An overview of each rule is summarised in the diagram below.

10 Golden Rules for Reforestation

Further details of each step are available on the Kew Gardens website.

Further reading

10 Golden rules for restoring forests – RBG Kew

Ten golden rules for reforestation to optimize carbon sequestration, biodiversity recovery and livelihood benefits – Report


Support for Geography in the News Assignment 

Describe the distribution of forest change shown on the choropleth map

This question is asking you to describe the distribution (spread) of forest change shown on the choropleth (shading) map. As this is an interactive choropleth map you can click on the colours in the scale to highlight the patterns. Describing patterns on a choropleth map is easy using the TEA tool as it provides a structure to your answer. TEA stands for trend, examples and anomalies.

Trend

To begin with, it is useful to include an opening statement about the general distribution (pattern/spread) shown on the map. You could do this by asking yourself does the choropleth map show the global annual change in forest area in 2015 even or uneven?

Paragraph starter: The global annual change in forest area in 2015 is even/uneven.

Examples

Next, you need to discuss the patterns on the map giving examples. You could consider:

  • What continents/countries are experiencing a decline in forest area?
  • Are the countries mainly HICs, NEEs or LICs?
  • Are they near the equator or further away?
  • Are they inland or coastal?
  • What continents/countries are experiencing an increase in forest area?
  • Are the countries mainly HICs, NEEs or LICs?
  • Are they near the equator or further away?
  • Are they inland or coastal?

Anomalies

Finally, consider any patterns/examples that stand out. In this example, are there any HICs (wealthy countries) that are experiencing high levels of decline in forest cover – top tip – check out North America!)? Are there any LICs/NEEs that are experiencing high levels of forest cover increase (have a look at Asia!)?

Creating an exam paper in Microsoft Forms

Internet Geography Plus subscriptions have funded the development of these free resources. Please consider taking out a low-cost subscription to help us develop more content for Internet Geography. 

Microsoft Forms quizzes are a simple and useful way for students to complete exam questions and papers. The benefit of using Microsoft Forms quizzes for exam questions is that it’s possible to automate some of the marking and feedback. In addition to this, marking is simplified because all the answers are in the same place, saving time when reviewing answers. Finally, Microsoft Forms provides an overview of performance that is useful for evaluating a group of students’ performance and identifying areas that need revisiting.

I’ve set up an example exam paper covering natural hazards using the 2018 AQA GCSE geography paper, which you can view and copy across to your Microsoft account by clicking the links below.  The support videos below explain how the form was set up (video 1) and how Microsoft Forms can mark the paper, allocate scores, and provide personalised feedback (video 2).

If you’ve developed an exam paper in Microsoft Forms and are happy to share it with the wider community, please drop us an email.

Link 1: The exam paper how the students will see it

Link 2: Copy the exam paper over to your Microsoft Forms account (it is unlikely the images will copy across so you may need to add these yourself)

Video 1 – Setting up an exam paper in Microsoft Forms

Video 2 – Marking, allocating scores and providing feedback

Coming Soon

Video 3 – Review the performance and export to Excel

Coming soon!

Storm Christoph

Storm Christoph is the third named storm of the 2020/2021 season and the first of 2021, following Storm Aiden on October 30 and Storm Bella on Boxing Day 2020.

Storm Christoph was a slow-moving Atlantic depression, which brought a variety of weather to the UK between the 19th and 21st of January 2021. The storm system moved across the UK from west to east.

Unlike the low-pressure systems that often affect the UK at this time of year, Storm Christoph’s main threat was heavy rainfall, rather than strong winds.

The map below shows flood warnings and the places with the most rainfall from Storm Christoph.

Storm Christoph rainfall and flood warnings

Storm Christoph rainfall and flood warnings – source

Preparation for Storm Christoph

An Amber National Severe Weather Warning for rain was issued for parts of northern and central England. Separate Yellow warnings for rain, wind, snow and ice covered large areas of England, Scotland, Wales and Northern Ireland.

The Environmental Agency and Met Office issued a series of warnings about Storm Christoph.

Flood Guidance Statement issued by the EA and Met Office

Flood Guidance Statement issued by the EA and Met Office

More than 400 flood warnings and alerts were issued across England. In Wales, 15 flood warnings and 53 flood alerts were in place.

The Prime Minister, Boris Johnson, advised people to act if instructed to evacuate.

Storm Christoph flood warnings

Local authorities issued warnings to local residents.

Several steps were taken to prepare areas previously affected by flooding. Fishlake, near Doncaster, was one of the worst affected areas in floods in November 2019. On Tuesday 19th January, residents readied themselves for their village to flood a second time in just over two years.

Many villagers had only been able to return to their homes for a matter of weeks, and some still haven’t managed to move back.

Doncaster Council said it had delivered 40,000 sandbags around the area since a flood alert was first issued.

Over 200 council staff in Fishlake joined with residents and volunteers to distribute sandbags days before Storm Christoph arrived, with each home receiving up to twenty.

A major incident was declared in South Yorkshire on Monday, with more than 40,000 sandbags distributed in flood-risk areas and a barrier built around a Covid vaccination centre in Mexborough.

In South Yorkshire, some roads were closed due to flooding, but no major incidents were reported. Flood wardens said improved flood defences and a changing forecast lessened the storm’s impact.

What were the effects of Storm Christoph?

Areas of the UK was hit by heavy rain, snow and flooding that has led to towns and villages being cut off and a major incident declared in South Yorkshire and Greater Manchester.

The northwest of England and the north of Wales were some of the worst affected areas as properties submerged as rivers burst their banks, and drainage systems failed to cope with the torrential downpours brought by Storm Christoph.

The Cheshire village of Lymm, a village of 12,000 people located 7 miles away from Warrington, experienced flooding. However, this was not on the same scale as the floods of November 2019. Although fewer than a dozen homes were submerged in the end, for many of those, it was the second such disaster in less than two years.

Around 400 homes were flooded as a result of Storm Christoph, the Environment Agency has confirmed.

Around 26,000 homes were protected from the various flood defence assets distributed by the Environment Agency. 600 people were on the ground, putting up temporary barriers, using pumps in Manchester areas with particular flood challenges.

Firefighters and police evacuated 2,000 homes and businesses in south Manchester on January 20 with 3,000 properties said to be at risk.

Houses on Walmer Street in Abbey Hey, Manchester fell into a giant sinkhole following heavy rainfall.

In Maghull in Merseyside and Ruthin, North Wales, families were also forced out of their homes due to rising floodwaters.

Travel suspensions were placed on services from Carlisle to Skipton or Maryport, all destinations from Rotherham Central, and between Manchester and Newton le Willows.

Rail services between Warrington Central and Liverpool Lime Street, Altrincham to Chester, and Wigan to Southport were also suspended. Rail services between Leeds and York via Garforth were disrupted due to flooding in the Garforth area, with bus services replacing trains throughout the day.

In South Wales, water built up in a mine shaft causing a “blow out” that flooded properties in Skewen, Neath Port Talbot. At least 80 people had to leave their homes in the village after flooding.

North Yorkshire County Council said more than 15,000 sandbags were at the ready around the county.

Flood plains near Cawood in North Yorkshire, have been storing vast amounts of water as rivers rose rapidly following Storm Christoph’s heavy rainfall. These are shown in the video below.

A Covid-19 testing centre at Meadowhall in Sheffield was closed until Friday 22nd January due to the risk of flooding.

As water moves through drainage basins, monitoring is ongoing in low-lying areas.

Insurance losses from Storm Christoph are predicted to be between £80million and £120million.


How do I install Mote to give verbal feedback in Google apps?

Mote is a Chrome extension that allows you to provide verbal feedback in Google Docs, Sheets and Slide. To install Mote, launch Chrome (if you don’t have it installed you can get it here), then go to the Chrome web store. Type Mote into the search bar of the Chrome store (top left). When you’ve found Mote click the install button and follow the on-screen instructions.

Install Mote

Once you’ve installed the plugin open either a Google Sheets, Docs or Slides file. You will see a new Mote icon (circled in red below).

More icon

Click the Mote icon. Click next when the pop-up below is displayed.


Next, you need to grant access to your microphone so voice messages can be recorded.


If you’re using a Mac, you will be prompted to allow Google Chrome to access your microphone. Click OK.


The confirmation message below will be displayed when your microphone is connected. Click Next.


You now need to grant Mote access so Sign in with your Google account.

Click Allow to grant permissions.


Click Allow.


A confirmation message will then be displayed.


Return to Google Slides, go to the slide you want to add your voice message to and then click the Mote icon. A window, like the one below, will pop-up. Click the icon in the pop-up and record your message.

Press the stop button. Then click INSERT.

You can also insert a voice message as a comment. Simply click the comment icon, then click the Mote icon.

Creating an exam paper in Google Forms

Internet Geography Plus subscriptions have funded the development of these free resources. Please consider taking out a low-cost subscription to help us develop more content for Internet Geography. 

Google Forms quizzes are a simple and useful way for students to complete exam questions and papers. The benefit of using Google Forms quizzes for exam questions is that it’s possible to automate some of the marking and feedback. In addition to this, marking is simplified because all the answers are in the same place, saving time when reviewing answers. Finally, Google Forms provides an overview of performance that is useful for evaluating a group of students’ performance and identifying areas that need revisiting.

I’ve set up an example exam paper covering natural hazards using the 2018 AQA GCSE geography paper, which you can view and copy across to your Google Drive by clicking the links below.  The support videos below explain how the form was set up (video 1) and how Google Forms can mark the paper, allocate scores, and provide personalised feedback (video 2). The final video illustrates how to review the cohort’s performance taking the paper and export the results into Google Sheets.

If you’ve developed an exam paper in Google Forms and are happy to share it with the wider community, please drop us an email.

Link 1: The exam paper how the students will see it

Link 2: Copy the exam paper over to your Google Drive (it is unlikely the images will copy across so you may need to add these yourself, this is explained in video 1 below).

Video 1 – Setting up an exam paper in Google Forms

Video 2 – Marking, allocating scores and providing feedback

Video 3 – Review the performance and export to Google Sheets

Coming soon!

How does washing your clothes lead to plastic pollution in the Arctic?

Every time we do the laundry, hundreds of thousands of tiny fibres – known as microfibres – are washed off our clothes, down the drain and into the environment.

Recent research has found high levels of microplastic fibres polluting the Arctic Ocean. These fibres most likely come from washing synthetic clothes in Europe and North America.

"<yoastmark

In Canada, the Ocean Wise Conservation Association found microplastics in 96 of 97 seawater samples taken from across the polar region. Ninety-two per cent of the microplastics found are fibres, and 73% originate from polyester clothing. The majority of the samples collected were from 3-8 metres below the surface, where much marine life feeds.

The 3-8m layer of seawater is a biologically important area where we find phytoplankton, zooplankton, small fish, big fish, seabirds and marine mammals, looking for food. Large animals such as turtles, albatross, seals and whales die through eating plastic, and there is no reason to think it was different for the smaller ones.

Another study by Ocean Wise in 2019, estimated 3,500tn plastic microfibers from clothes washing in the US and Canada end up in the sea each year; the equivalent in weight to over 20 blue whales!

As well as the fibres found at the North Pole, plastic exists at the deepest point on Earth, the Mariana Trench, and Mount Everest’s peak. Plastic injures wildlife when it is mistaken for food. People also consume microplastics through food and water and breathe them in. However, the health impact of this consumption is not currently known.

Most of the water that flows into the Arctic comes from the Atlantic Ocean. The new research has found more microplastic fibres nearer the Atlantic, than the Pacific Ocean. As you can see from the map showing ocean current below, the North Atlantic Drift transports microplastics released into the North Atlantic.

Major ocean currents

Major ocean currents

What is the Impact of ocean life ingesting microplastics?

Research by The University of Exeter has shown that tiny marine animals called zooplankton, a vital food source for many larger animals like fish and whales, can eat microplastics. When Zooplankton eat microplastics they consume less of their normal food, meaning they get less energy from their diet. This leads to less energy for growth and reproduction. At this point, the microplastics enter the food chain.

As larger animals consume plankton, the concentration of plastic increases. Chemicals attached to microplastics can increase liver toxicity and other pathological changes.

Microfibers fill the bellies of fish, and, while the plastic remains in their guts, the toxins that microfibers contain can migrate into fishes’ flesh, consumed in turn by humans. Researchers found that about 25 percent of individual fish and 67 percent of all species intended for human consumption contained plastic debris, the majority being microfibers.

There is the potential for microfibers to have a negative impact on the fishing industry in the future. Catches may decline due to a breakdown in the ocean food chain. Additionally, demand for seafood may reduce as people become more aware of the impacts of microfibers.

There are, however, economic opportunities in finding solutions to reducing microfiber emissions in the design of innovative laundry traps.

What can we do to reduce the release of microplastic into the sea?

We all have a role to play in reducing microplastic levels in our oceans. As consumers, we can: 

  • wash clothes less often (give them the sniff test before putting them in the wash!)
  • air dry clothes rather than using the tumble drier. This is because tumble drying weakens clothes and makes them more likely to shed microplastics when washed.
  • choose clothes made from natural fibres such as cotton
  • fill our washing machines (the more room clothes have the more likely microfibres will break off)

Drowning in Plastic Video Questions

Nicola Sutton has kindly shared a Microsoft Form containing questions relating to Drowning in Plastic. This has also been copied across to Google Forms. copy the questions across to your Microsoft or Google account using the links below.

Microsoft Forms Drowning in Plastic Video Questions

Google Forms Drowning in Plastic Video Questions

Population Changes in South Korea

Population Changes in South Korea

South Korea’s birth rate has fallen for the first time in its history. As a high-income country, South Korea is battling an ageing population and low birth-rates.

An ageing population is when more people than ever live longer, often with more complex medical conditions. An ageing population increases the dependency ratio and means that the government has to pay more in benefits to people who often do not have the ability to pump money back into the economy.

The latest census (a count of all people and households) figures indicate South Korea’s total population stood at 51,829,023 at the end of December 2020. This is a reduction of 20,838 from the previous year.

Over the previous decade, South Korea’s population had increased every year, although that growth rate had decreased by 1.49% in 2010 to 0.05% by 2019.

During 2020 the country recorded 275,815 births in 2020, compared with 307,764 deaths.

If current trends persist, the government predicts South Korea’s population will drop to 39 million by 2067, when more than 46% of the population will be aged over 64.

Demographic transition

The animation below shows changes in South Korea’s population structure between 1950 and 2019. The animation clearly shows an increase in life expectancy (more people living to an older age) and a decrease in the proportion of younger people (as the birth rate decreases).

South Korea is undergoing an extreme, rapid example of what demographers (people who study population) call ‘demographic transition’. This is a period of population growth, decline and eventual stabilisation that occurs as countries get richer. For South Korea, this means both a large, rapidly ageing population and a low marriage and birth rate that don’t adequately replace the dying generations.

The demographic transition model attempts to show the population changes a country experiences as it develops.

In later stages of the demographic transition, health care improvements generally lead to a population with an extended life expectancy. That is exactly what is happening in South Korea, where life expectancy has increased rapidly in the second half of the 20th Century amid industrialisation.

In the first half of the 1950s, life expectancy was just shorter than 42 years on average (37 for men, 47 for women). Today, the numbers look radically different. South Korea now has one of the world’s highest life expectancies – ranked twelfth highest for 2015-2020, equal with Iceland. The average baby born in South Korea can now expect to live to 82 years (specifically 79 for men, and 85 for women).

In contrast, the global average is 72 years (nearly 70 for men, 74 for women).

In 1950, less than 3% of the population were aged 65 and over. Today, that number is at 15%. By the mid-2060s, the UN forecasts the percentage of those older than 65s will peak at more than 40%. The numbers paint a picture of a very aged society.

And with low birth rates, fewer marriages and longer lives, the trends combine to create a South Korean population that is actually ageing faster than any other developed country.

Why is South Korea’s population in decline?

South Korea has the lowest fertility rate in the world.

The average South Korean woman has just 1.1 children, lower than any other country. (For contrast, the global average is around 2.5 children.) This rate has been declining steadily: between the early 1950s and today, the fertility rate in South Korea dropped from 5.6 to 1.1 children per woman.

One reason for this is because, in South Korea, women struggle to achieve a balance between work and other life demands.

It has been suggested there is increasing opposition among South Korean women to conform to traditions of raising children and caring for ageing in-laws while husbands work.

South Korean women aren’t simply choosing to have fewer children – some are opting to forego romantic relationships entirely. An increasing number are choosing never to marry at all, turning their backs on legal partnerships – and even casual relationships – in favour of having independent lives and careers in what can still be a sexist society despite economic advances.

Soaring house prices are another major issue. Rapidly rising property prices mean a greater proportion of income is spent on mortgages. Also, young couples are put off having children because they are expensive to raise.

What issues are associated with a declining, ageing population?

Apart from increased pressure on public spending as demand for healthcare systems and pensions rise, a declining youth population also leads to labour shortages that directly impact the economy.

What is South Korea doing to address the issue of a declining, ageing population?

Like Japan, which also has a declining population, the government is under pressure to address the long-term issues caused by a rapidly ageing society.

The South Korean government recently announced initiatives to encourage couples to have bigger families, including a one-off payment of 1m won (£675) for pregnant women and monthly cash allowances for children aged under 12 months.

However, critics say the measures do little to tackle much bigger financial obstacles to having more children, such as high education and housing costs.

Short Answer Quizzes

With the increasing use of Google and Microsoft forms for remote learning, we’ve converted many of our multiple-choice booklets into Google and Microsoft forms for Internet Geography Plus subscribers to copy. Forms are self-marking which saves you time!

So far, Plus subscribers have access to all the AQA GCSE paper 1 and 2 quizzes, Edexcel A and B quizzes are being developed (there are several units for both specs) along with OCR.

We are also developing a bank of case study multiple choice quizzes too.

Case Study Multiple Choice Quizzes

Case Study Multiple Choice Quizzes

As well as developing a bank of multiple-choice quizzes in Microsoft and Google Forms format, we are also developing a collection of self-marking, short answer quizzes too. Over the coming weeks, there will be a large number of these quizzes added to the Plus area of Internet Geography. To illustrate what these quizzes will look like, and hopefully save you some time, we’re sharing one of these quizzes in Google and Microsoft Form format. Just click the links below to copy the quizzes (please ensure you are logged into your Google/Microsoft account before clicking the links).

Log in to access all the Microsoft/Google Forms or take out a low-cost annual subscription starting from just £20 per year.

Free Forms

Microsoft Forms: Coastal Processes – erosion, transportation and deposition

Google Forms: Coastal Processes – erosion, transportation and deposition

A Perfect Planet Classroom Resources

A Perfect Planet is a new TV series in which David Attenborough explore the forces that make life possible on planet Earth.

Episode 1 – Volcanoes

BBC iPlayer link

Classroom resources: 

Video questions

Episode 2 – The Sun

BBC iPlayer link

Classroom resources:

Video questions

Episode 3 – The Weather

BBC iPlayer link

Classroom resources:

Video questions – kindly shared by @MrsJeffsGg