Analysing data from a self-marking quiz using Google Forms with Flubaroo
Having recently published a guide to creating a self-marking quiz using Google Forms we thought it would be useful to share some next steps that are worth exploring.
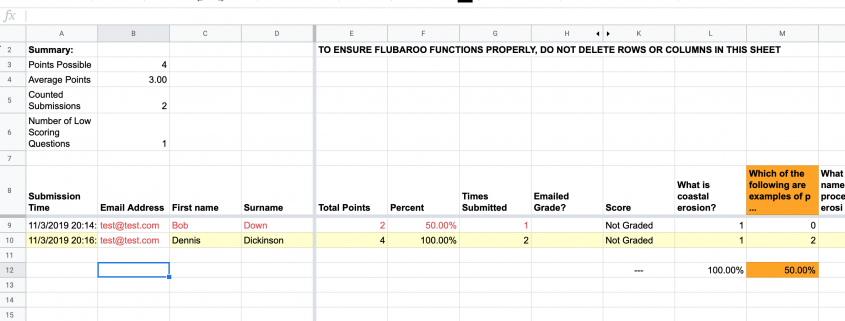
To begin with, we’ll look at a useful plugin to analyse the data generated by students completing a multiple choice quiz. The screenshot below shows an example of what the add-on we will use can do. As you can see, the whole class and individual data is analysed. The question in orange menas less than 60% of students go the answer wrong. Students in red have achieved less than 70%. This feedback can then be used to identify misconceptions or gaps in learning which can then be addressed in class.
Analysis of data
Towards the end of the creating a self-marking quiz using Google Forms guide, we showed you how to create a spreadsheet containing results. As a reminder, simply go to your quiz form and click the Google Sheets icon.
Click the Google Sheets icon
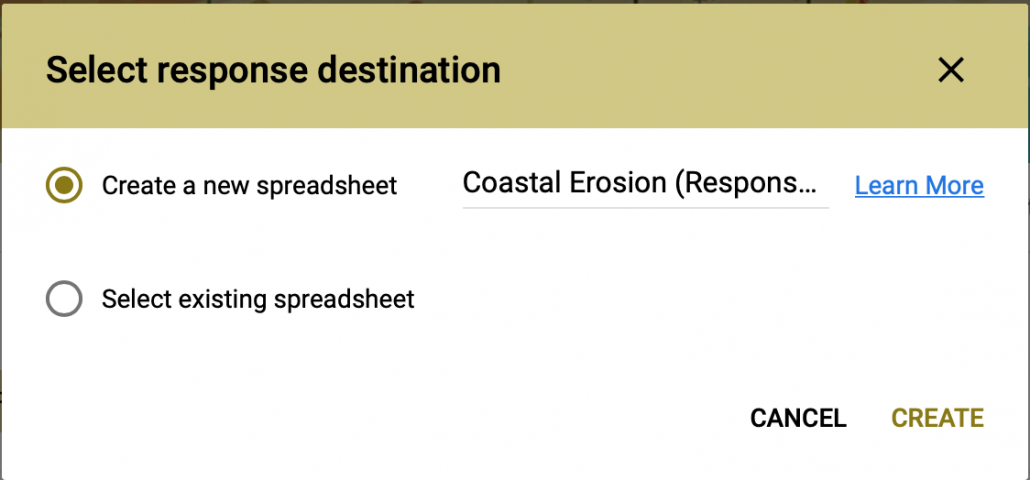
You are then given the option to Create a new spreadsheet or Use and existing spreadsheet. You could either maintain seperate spreadsheets for each quiz or have one dedicated spreadsheet with multiple sheets for your quizzes. This will be a personal choice to do what works for you.
Create a new spreadsheet or Select existing spreadsheet
Once you’ve selected the option, clicking the Google Sheet icon now opens the spreadsheet showing the result. We are now going to install a plug in on your spreadsheet that will automate analysing the results. A plug in is a programme that adds features to your Google Sheet.
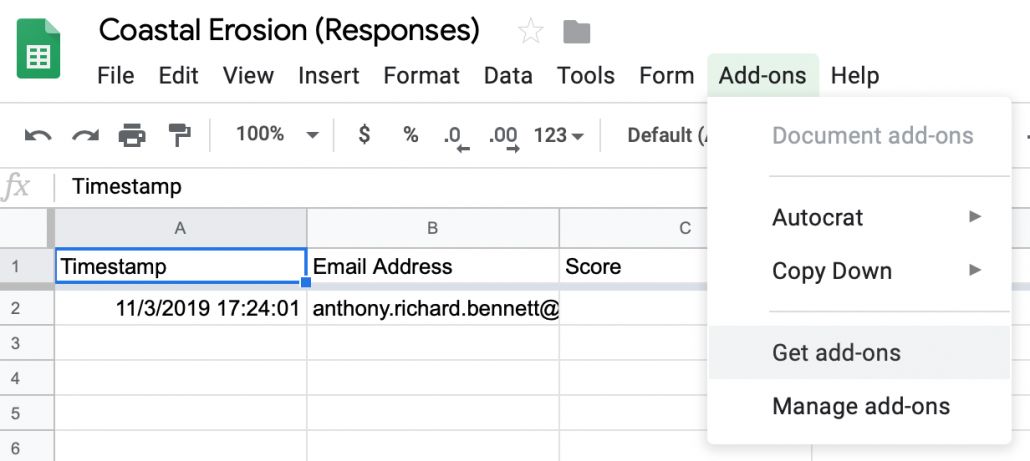
Open your Google Sheet then click Add-ons then Get Add-ons.
Get add-ons
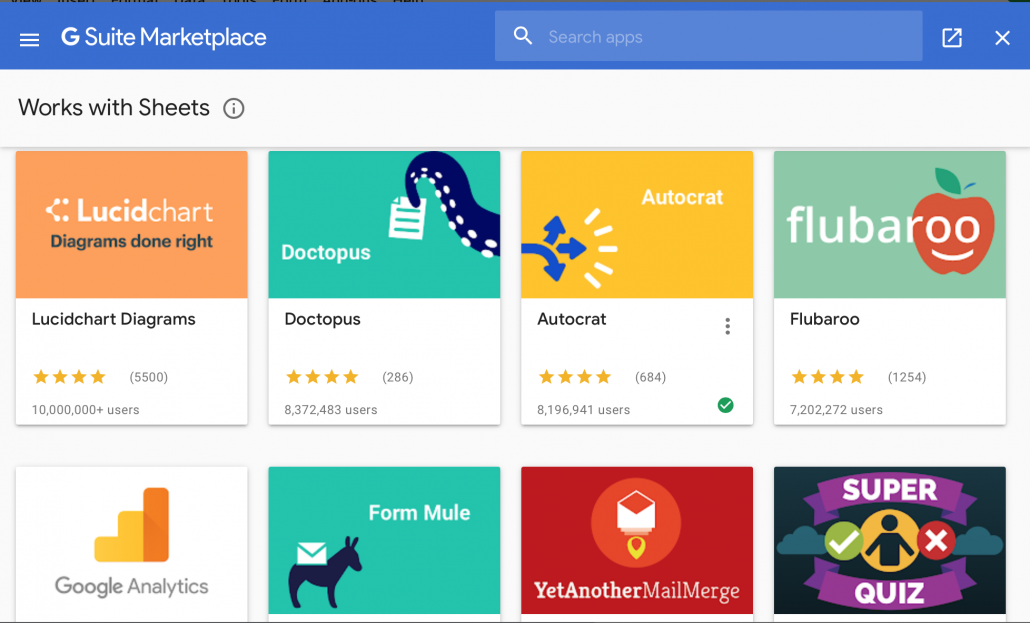
A window will pop-up as shown below. Select flubaroo. If it is not shown in the window then do a search for it. Click the icon, then click Install. Press continue and agree to the terms and conditions. Click done once the plug-in is installed.
Select the flubaroo plug-in
Return to your Google Sheet. You will not notice any difference to the spreadsheet at this stage.
Next, go to the live form and complete it as a student would, ensuring all the correct answers are selected. Be sure to enter your name too, so you can identify this entry later on as the answer key. Click submit.
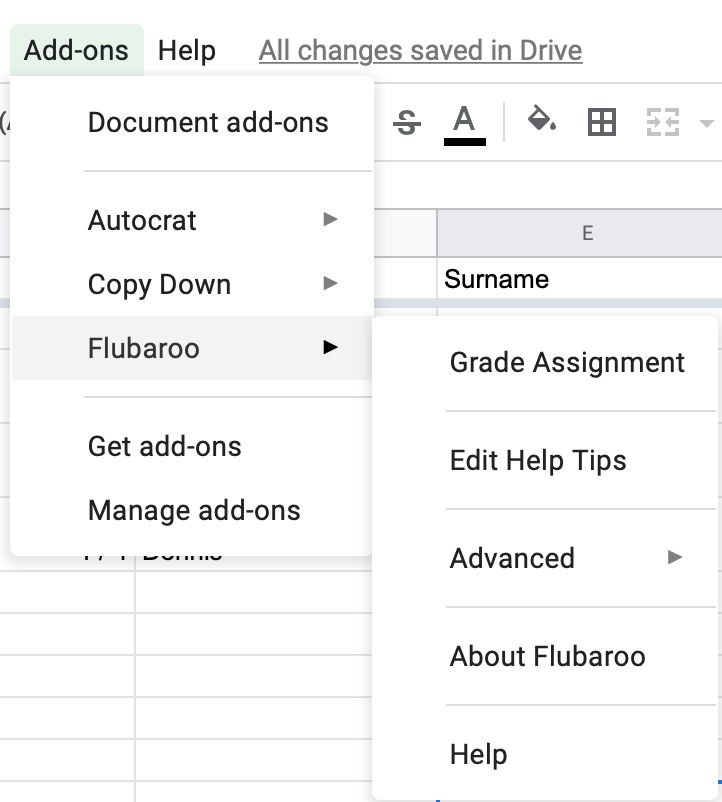
Next, return to your Google Sheet. Go to Add-ons > Flubaroo > Grade Assignment.
Grade assignment
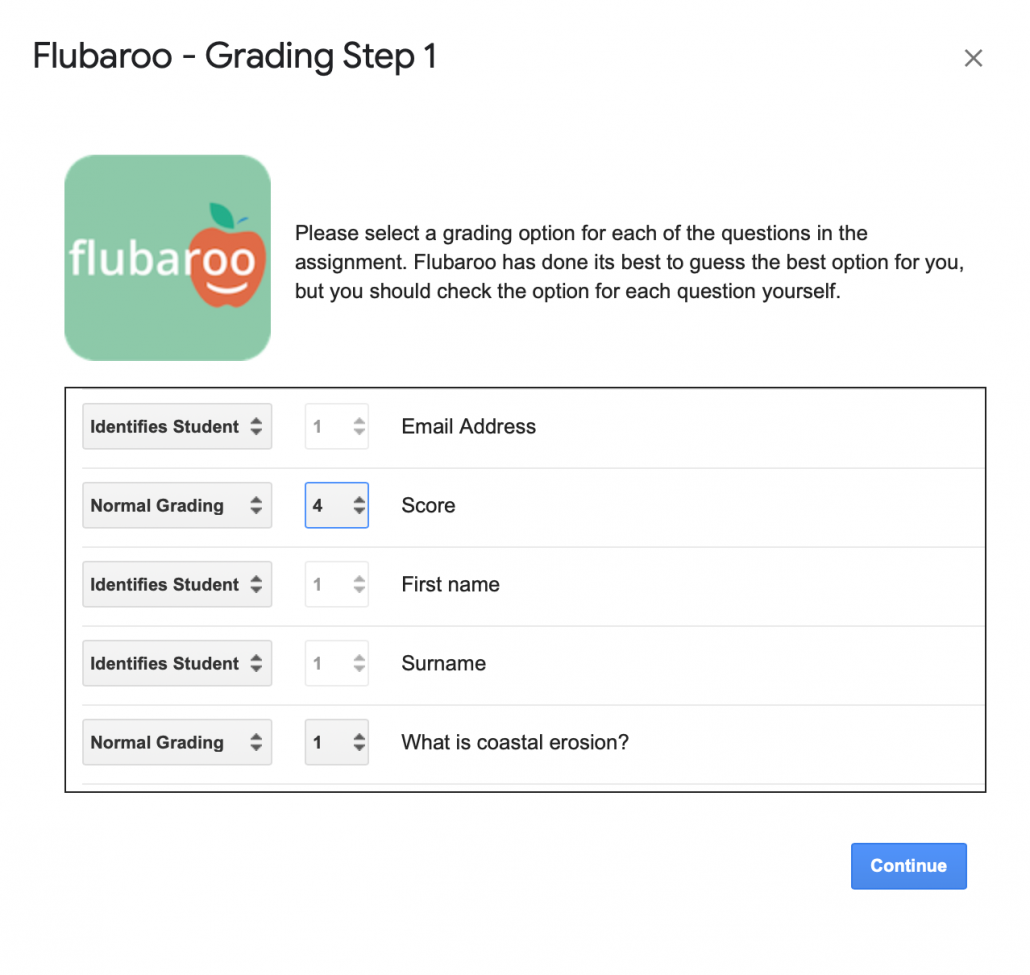
Flubaroo will ask you a few questions, such as:
- If any questions should not be graded.
- Which questions are for the purpose of student identification (e.g. name, student id, email).
- Which submission should be used as the answer key.
Be sure to select skip grading for the score, otherwise this will be added to the scores to the individual questions.
Grading Step 1
Once answered, Flubaroo will grade your assignment. This process should take less than a minute.
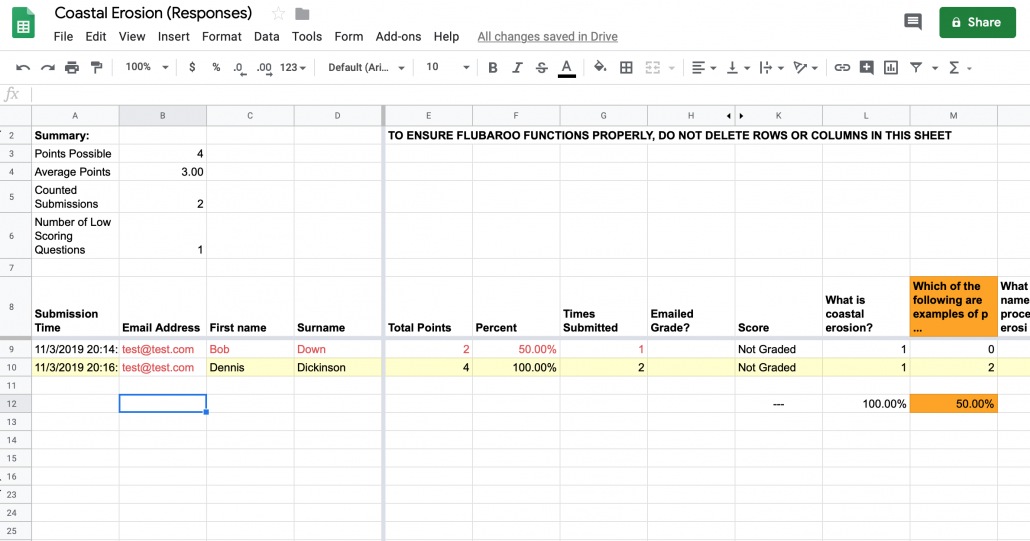
A new sheet is created displaying individual and group performance data. If less than 60% of students got a question correct, the question will be highlighted in orange to alert you. Additionally, students who scored less than 70% on the assignment will be highlighted in red.
Analysis of data





Leave a Reply
Want to join the discussion?Feel free to contribute!