Free Geography Infographic
Over the past few months, we’ve been developing a range of infographics covering common case studies in geography. The infographics provide a summary overview of the main features of each case study and are available as A3 PDFs and resizable .png graphics. The infographics can be printed for wall displays, collated into revision booklets and sent home with students to decorate their bedroom walls for revision.
- Set 1
- Set 2
- Set 3
- Set 4
Infographics often prove so effective in educational contexts because they use imagery to highlight, explain, or enhance text-based information. They have the unique ability to capture attention, convey information, and encourage data retention despite their complex nature.
Our eight sets of geography infographics are available for free to Internet Geography Plus subscribers or can be purchased from our online shop.
Following a recent request from an Internet Geography Plus subscriber, we’ve just created an infographic covering Hurricane Matthew. We’ve made this available to download for free below.
Download Hurricane Matthew PDF
If you’re an Internet Geography Plus subscriber and have an infographic request please contact us.
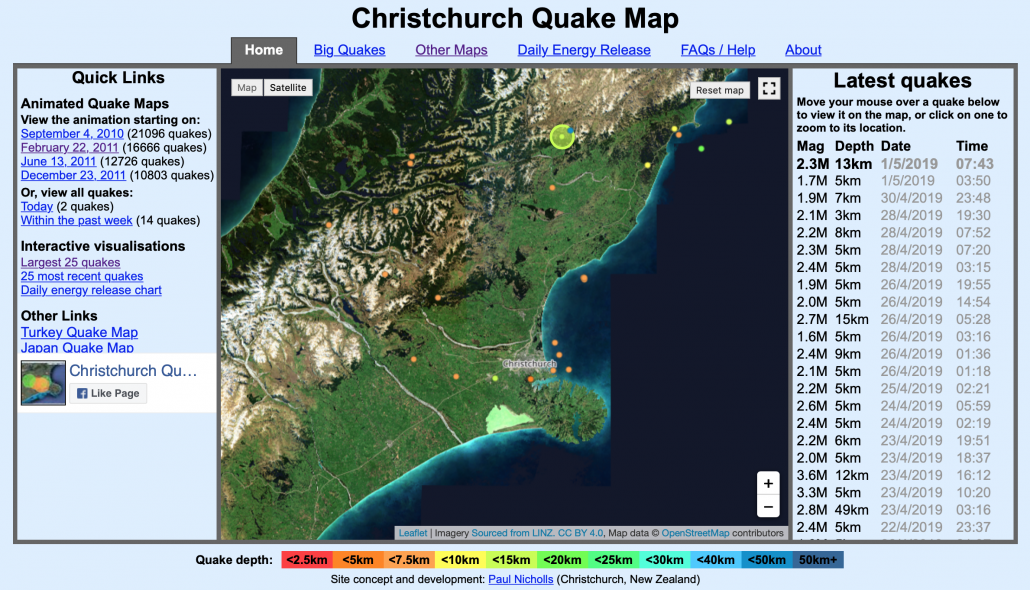
Christchurch Earthquake Animated Map
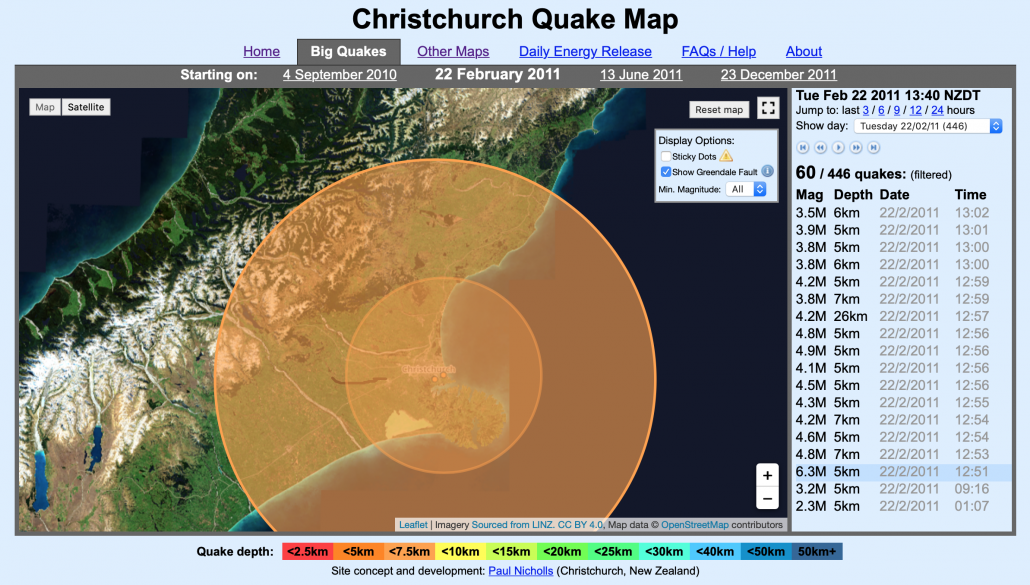
Christchurch earthquake map is a fantastic resource for illustrating the swarm of earthquakes that occurred on February 22nd 2011, when 185 people were killed as the result of a magnitude 6.3 quake.
To access the resources head over to the Christchurch earthquake map

Christchurch Earthquake Animated Map
Next, click February 22, 2011 under quick links (on the left of the page). The animation will start automatically. The magnitude and depth of the earthquakes are illustrated using coloured proportional circles.

2011 Christchurch Earthquake Map
You can speed up and slow down the animation using the media controls to the top right of the page.
We’ve recently added Christchurch earthquake case study resources on Internet Geography.


