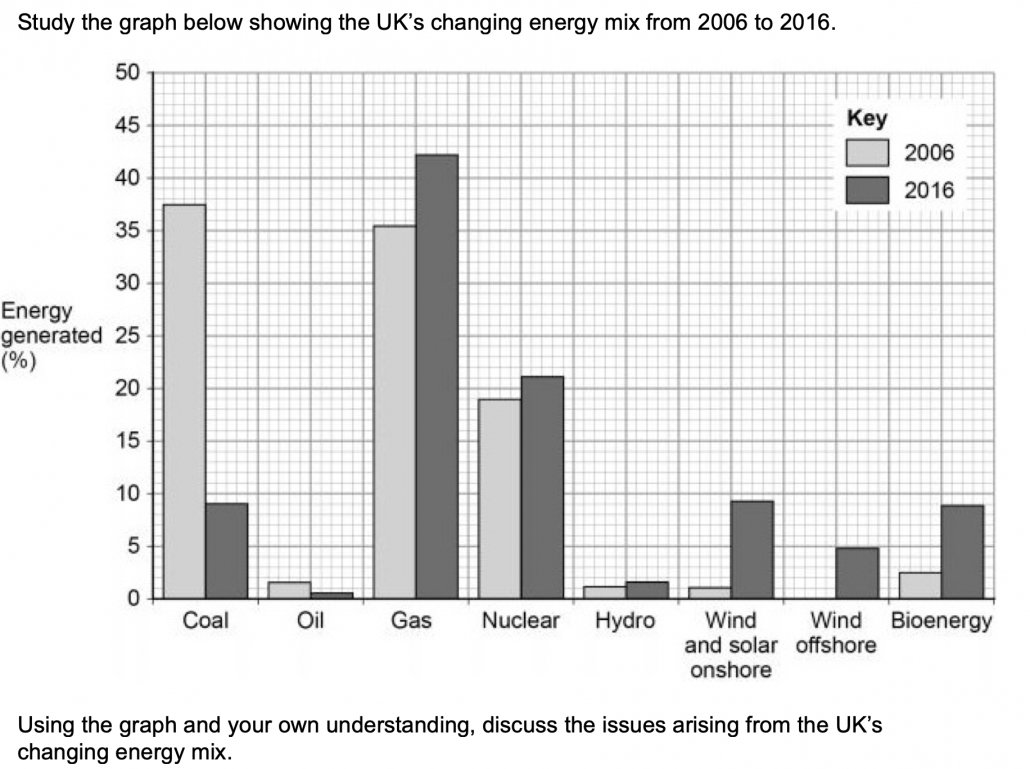
When faced with exam questions like the one below students often fail to use the resources they have been provided with. This is an issue often referred to in examiners reports and frequently bemoaned by teachers on social media.
Exam question with resources
To support teachers modelling the deconstruction of exam questions that include additional resources, we’re in the process of developing a series of resources that aim to support geography teachers in taking students through breaking down exam questions, analysing data they are provided with and working out what should be included in their answer.
In this first set of resources, we explore the above exam question from the 2018 AQA GCSE Geography paper 2, covering resources. This is an area covered in multiple specifications so should be useful to most geography teachers.
These free resources come in both Apple Keynote and Microsoft PowerPoint format so can be edited to meet the needs of your students. The presentations take a step-by-step approach to reviewing the question, resources and what could be included in the answer. All you need to do is talk the students through it.
If you’ve found these resources useful or have requests for future questions please leave us a comment below.
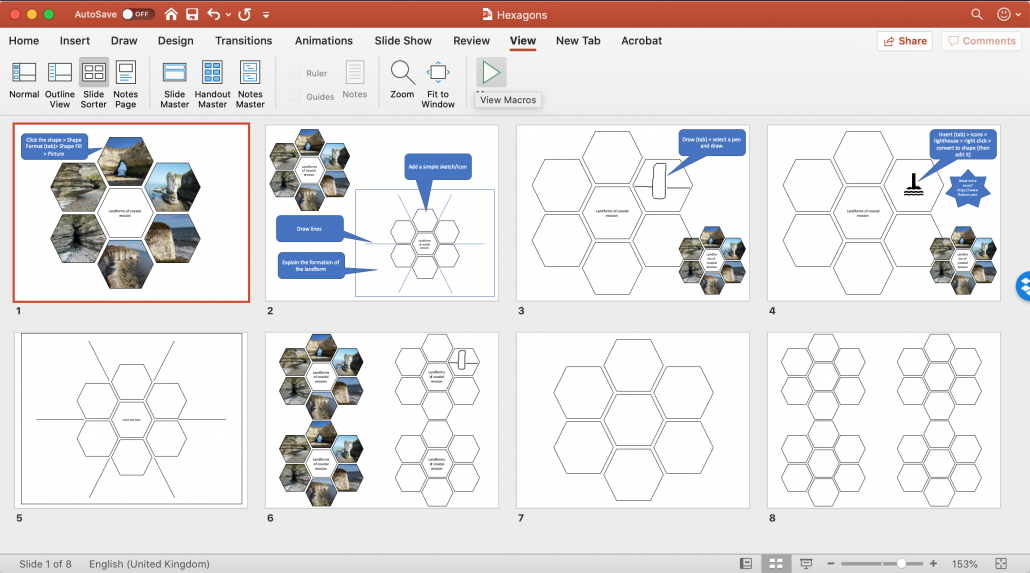
The use of hexagon thinking tasks has been popular on twitter recently. The principle is simple, students are to describe what the hexagon shows and how it relates to the content of the central hexagon.
If you have hexagon thinking task resources that you are willing to share please send them to [email protected] and we’ll publish them below.
We’ve put together a template to support teachers in using them.
Click the image below to download the template.
Hexagon thinking tasks shared by the geography teacher community
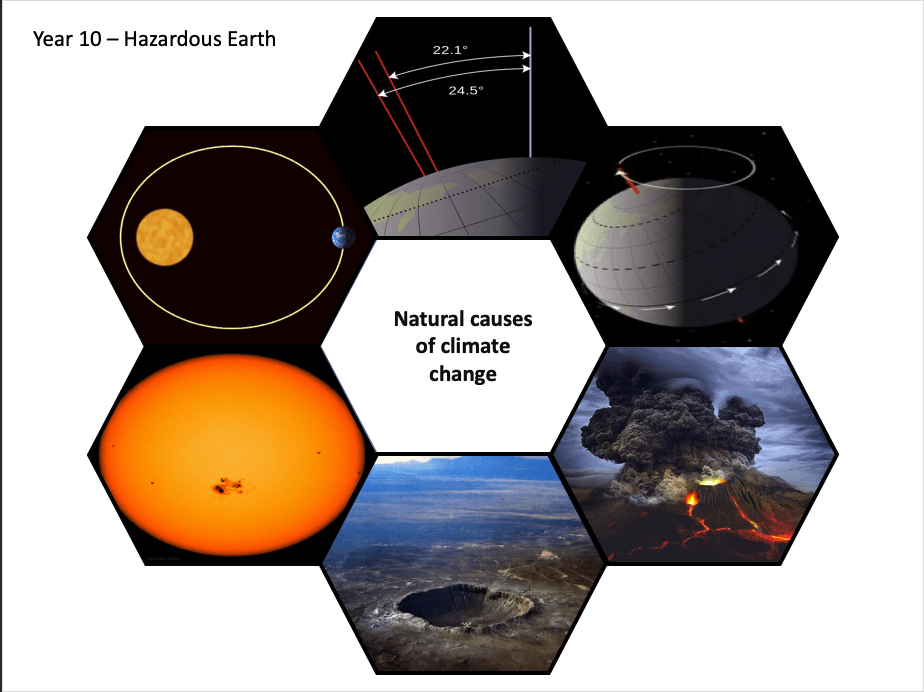
Stephanie Ramsdale (@geog_missR) has shared a collection of hexagon thinking tasks covering sustainable urban development, evidence of climate change, natural causes of climate change and contested borders in Taiwan. Click the image below to download.
Geographers see connections in the world, how things interact and inter-relate. Making links in geography involves examining relationships within and across themes. An understanding of these links supports students in seeing how the world is interconnected.
One strategy to encourage students to investigate links could involve the use of concept maps. However, before your students attempt their own concept maps it would be useful to live model links with them. Enter KnowledgeBase Builder.
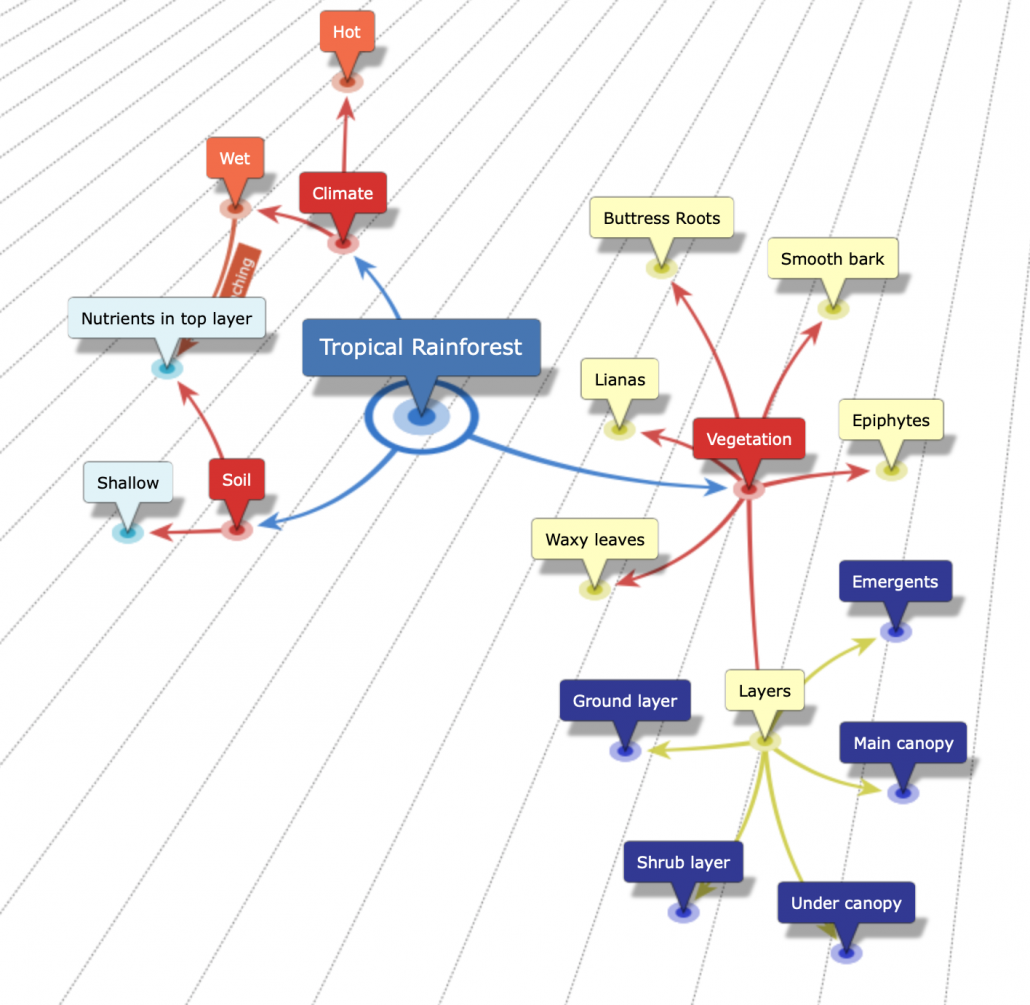
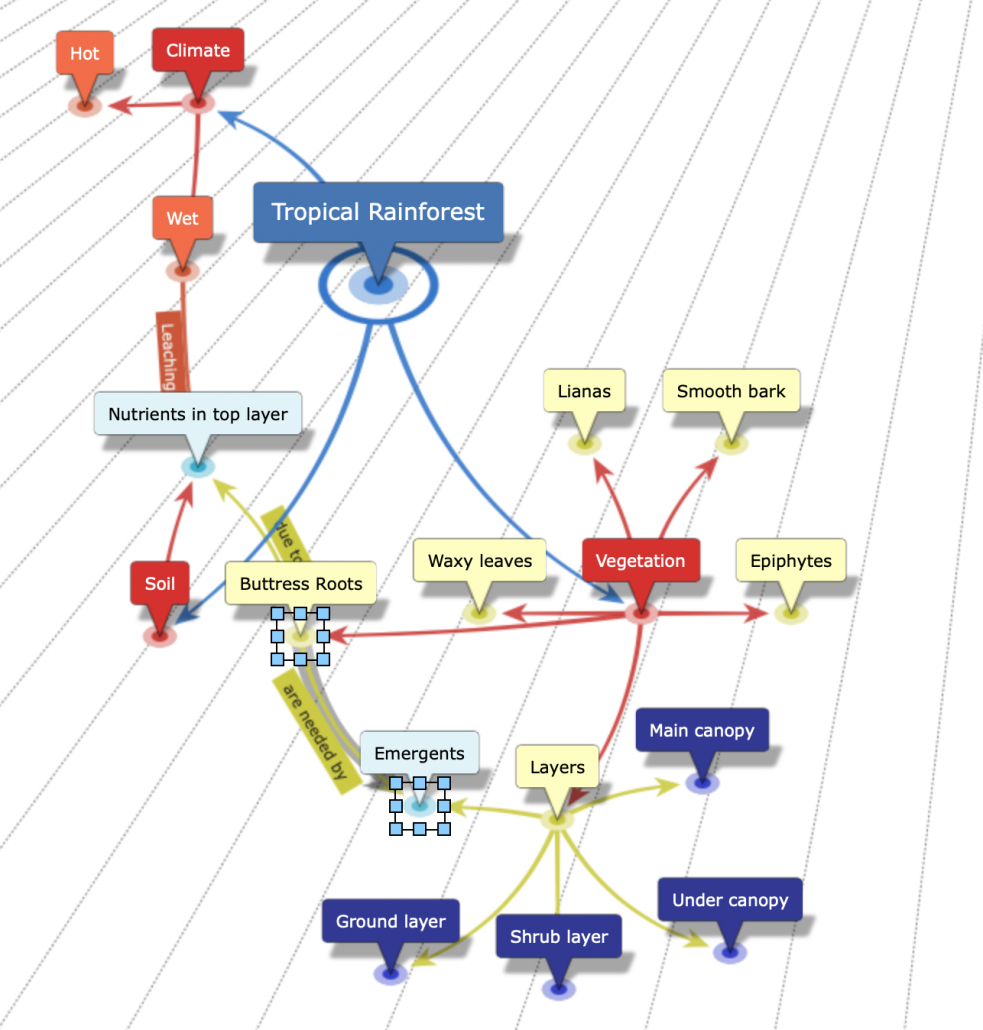
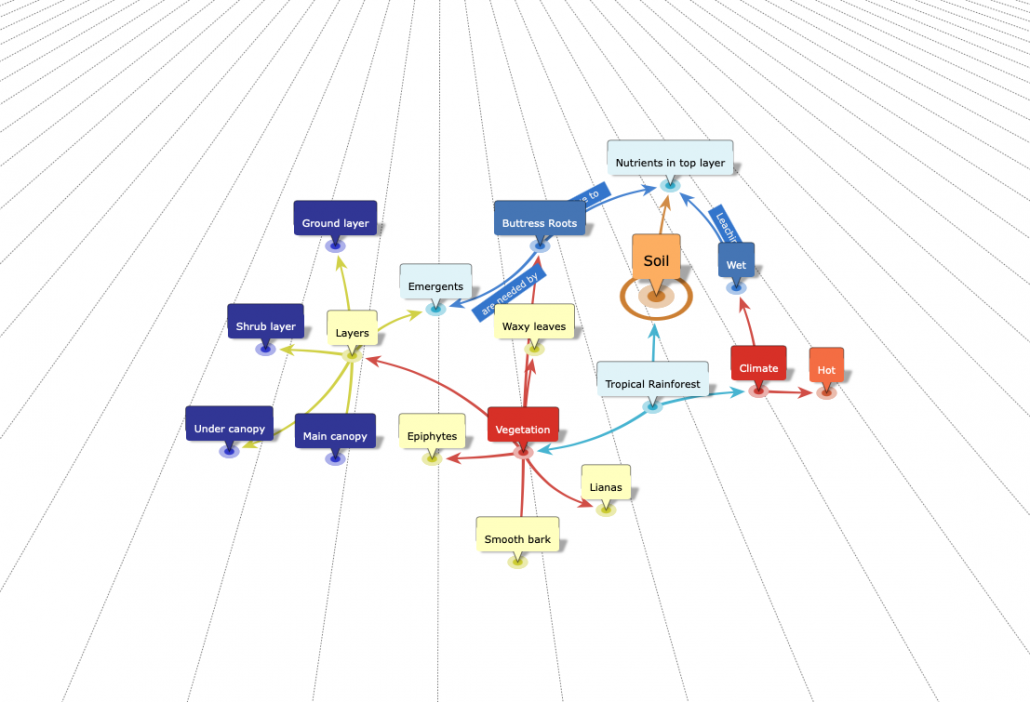
Available for Windows, Android, IOS and Mac OS, KnowledgeBase Builder is a remarkably easy tool to map out curriculum content then investigate links. In the example below, we have produced a simple map the characteristics of the tropical rainforest (for demonstration purposes, there’s lots more that could be added). The characteristics are grouped under headings including vegetation and climate etc. This could be achieved by students contributing key features based on prior learning.
Characteristics of tropical rainforests
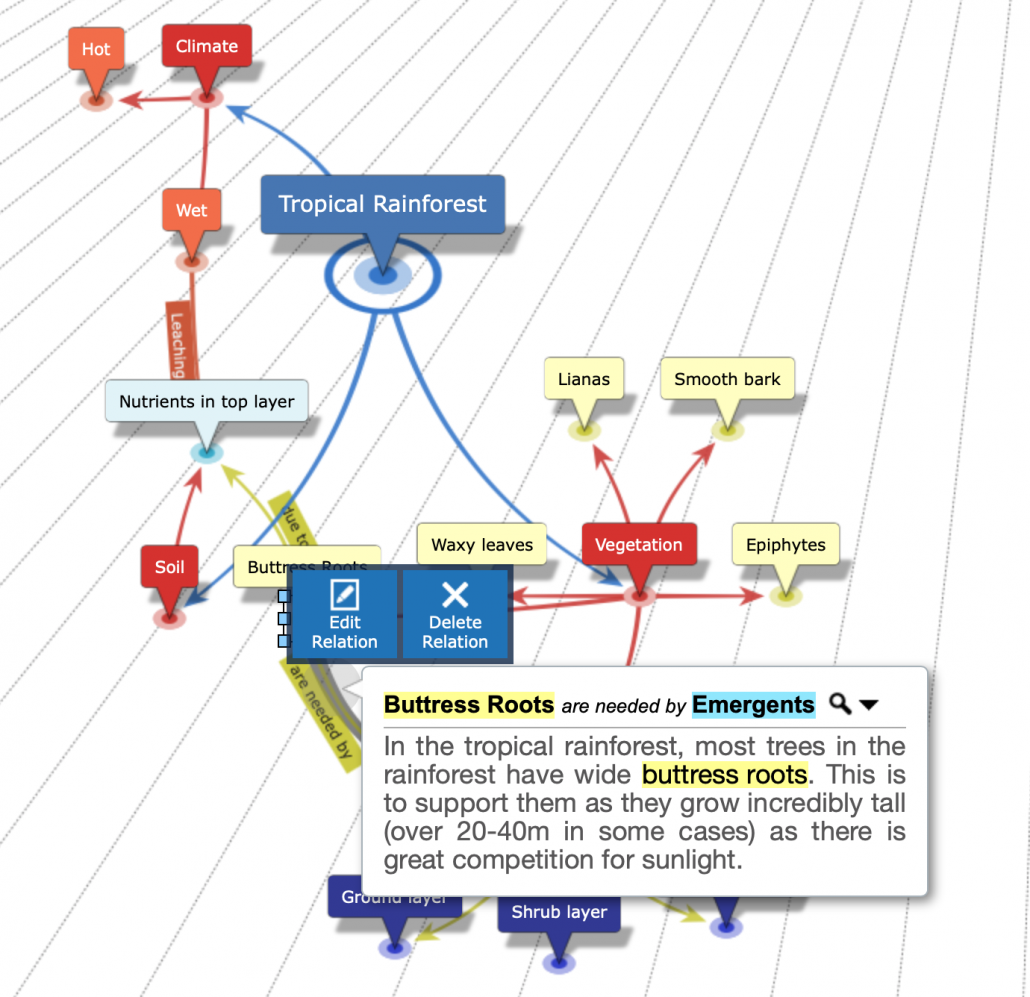
Next, it’s time to investigate links between the different characteristics. Simply drag a connection between two elements, give it a simple title and an explanation of how the two are connected. Below is an example of a link between buttress roots and emergents.
Making a link
Once an explanation has been added in the description box, simply click the link to display the explanation as shown below.
View the link
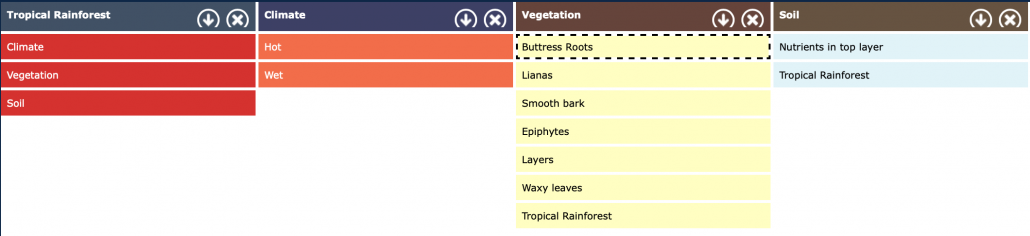
You can view your map in a range of ways including as a table which shows the main characteristics as shown below.
Information presented as a table
You can also view the map in 3D. Which looks pretty fancy! It is possible to save the 3D graphic as an animated gif.
There are several options for exporting your finished diagram. Below is an example of an exported image.
The information can also be exported as an HTML file (web page).
Other features included in the software to explore include:
adding images
reverse links where flows/links go in both directions
adding hyperlinks
embedding Wikipedia pages
In this example we have explored links within a theme, however, we can just as easily develop a map over time and explore synoptic links in geography.
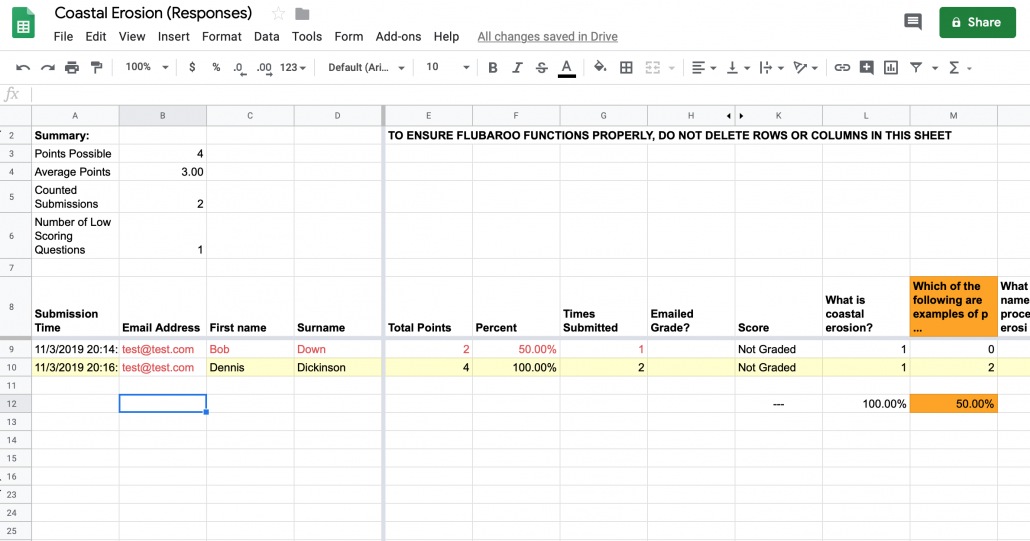
To begin with, we’ll look at a useful plugin to analyse the data generated by students completing a multiple choice quiz. The screenshot below shows an example of what the add-on we will use can do. As you can see, the whole class and individual data is analysed. The question in orange menas less than 60% of students go the answer wrong. Students in red have achieved less than 70%. This feedback can then be used to identify misconceptions or gaps in learning which can then be addressed in class.
Analysis of data
Towards the end of the creating a self-marking quiz using Google Forms guide, we showed you how to create a spreadsheet containing results. As a reminder, simply go to your quiz form and click the Google Sheets icon.
Click the Google Sheets icon
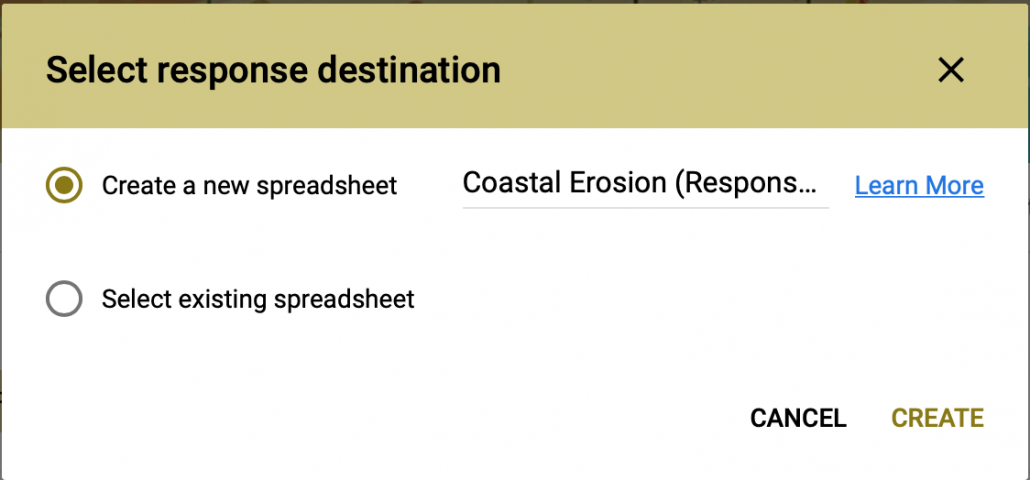
You are then given the option to Create a new spreadsheet or Use and existing spreadsheet. You could either maintain seperate spreadsheets for each quiz or have one dedicated spreadsheet with multiple sheets for your quizzes. This will be a personal choice to do what works for you.
Create a new spreadsheet or Select existing spreadsheet
Once you’ve selected the option, clicking the Google Sheet icon now opens the spreadsheet showing the result. We are now going to install a plug in on your spreadsheet that will automate analysing the results. A plug in is a programme that adds features to your Google Sheet.
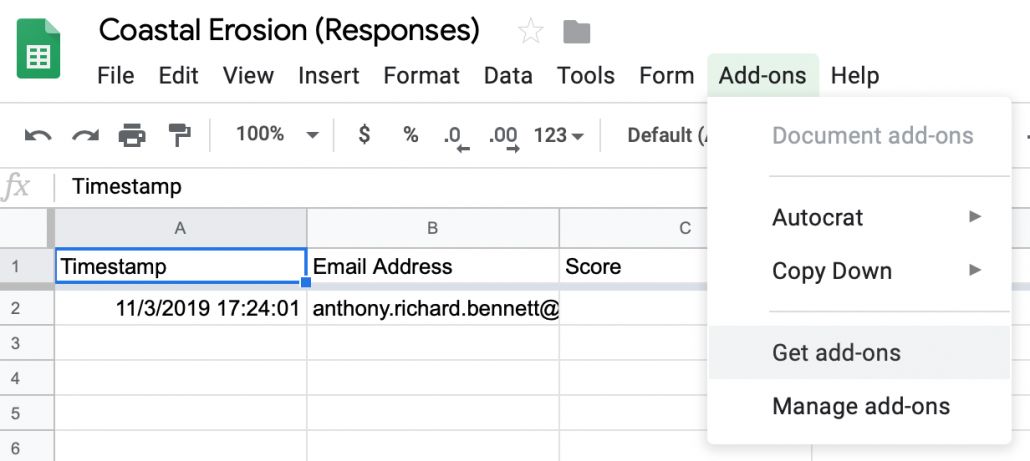
Open your Google Sheet then click Add-ons then Get Add-ons.
Get add-ons
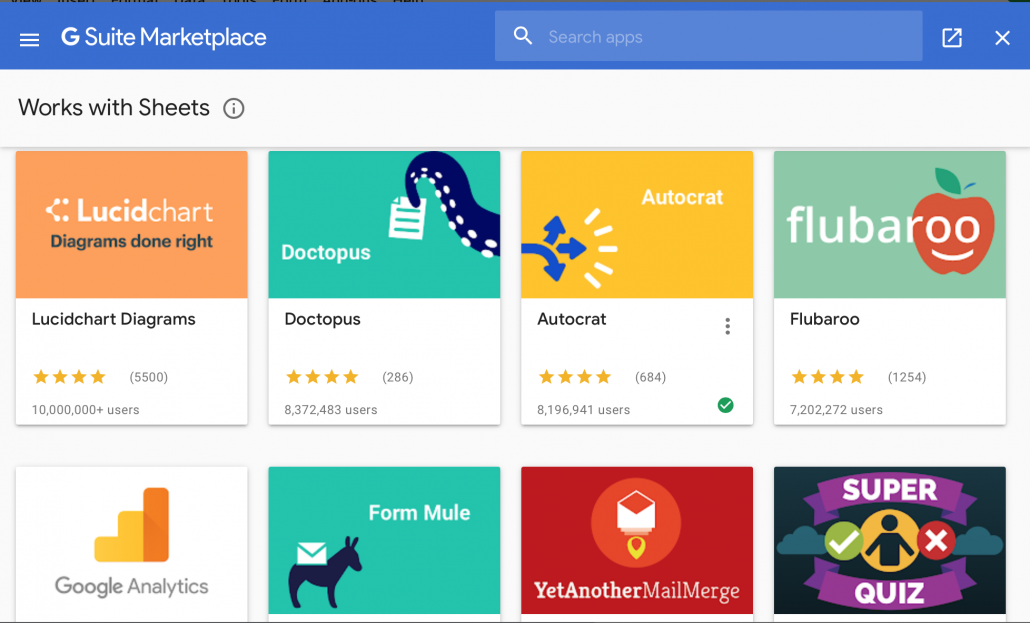
A window will pop-up as shown below. Select flubaroo. If it is not shown in the window then do a search for it. Click the icon, then click Install. Press continue and agree to the terms and conditions. Click done once the plug-in is installed.
Select the flubaroo plug-in
Return to your Google Sheet. You will not notice any difference to the spreadsheet at this stage.
Next, go to the live form and complete it as a student would, ensuring all the correct answers are selected. Be sure to enter your name too, so you can identify this entry later on as the answer key. Click submit.
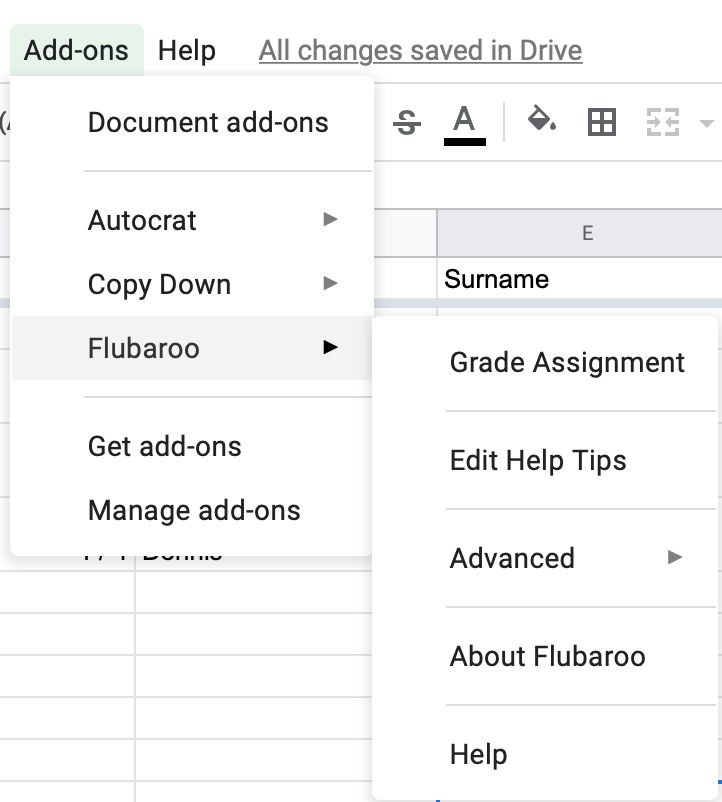
Next, return to your Google Sheet. Go to Add-ons > Flubaroo > Grade Assignment.
Grade assignment
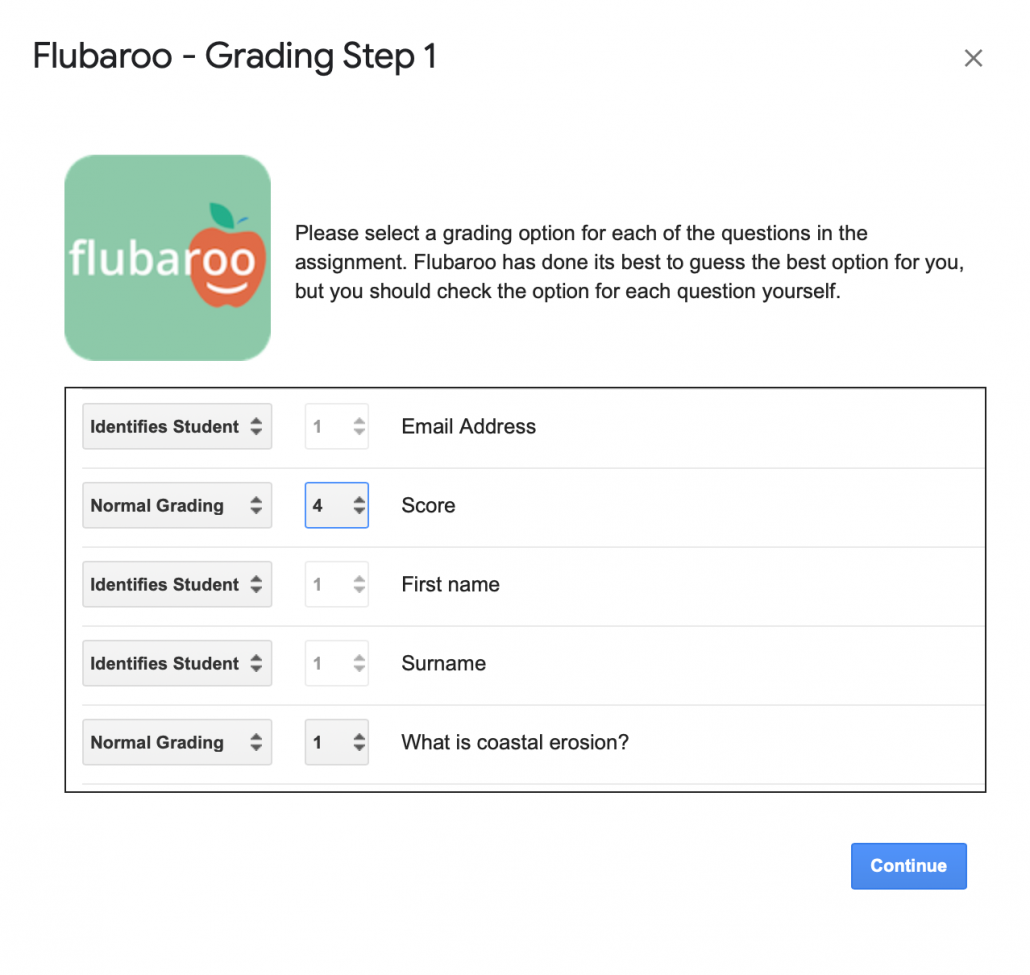
Flubaroo will ask you a few questions, such as:
If any questions should not be graded.
Which questions are for the purpose of student identification (e.g. name, student id, email).
Which submission should be used as the answer key.
Be sure to select skip grading for the score, otherwise this will be added to the scores to the individual questions.
Grading Step 1
Once answered, Flubaroo will grade your assignment. This process should take less than a minute.
A new sheet is created displaying individual and group performance data. If less than 60% of students got a question correct, the question will be highlighted in orange to alert you. Additionally, students who scored less than 70% on the assignment will be highlighted in red.
https://www.internetgeography.net/wp-content/uploads/2019/11/Analysis.png8411600Anthony Bennetthttps://www.internetgeography.net/wp-content/uploads/2024/01/Internet-Geography-Logo.pngAnthony Bennett2019-11-04 19:47:262019-11-04 21:06:02Analysing data from a self-marking quiz using Google Forms with Flubaroo
This is the ninth collection of useful tweets relating to #geography and #geographyteachers. The world of Twitter can be a busy place so I’ve pulled together some tweet treats from the last week or so that are worth having a look at. Tweets are in no particular order.
Check out geography-related TV this week with geogglebox by @lenziegeo
This longshore drift mystery by @geog_brown looks great!
So excited to try out this Longshore Drift mystery lesson with Year 7s! I got the inspiration from a free TES resource. They have to figure out how a message in a bottle moved from one place to another. 🌊 #pgce#geographyteacher#geographypic.twitter.com/olejR1cZmm
Stripped back structure strips by @Geo_Dougie are a great way to incorporate questioning into the process of developing a structure to geographical questions.
@BeingMissSpeed has shated some fantastic resources ‘Check 20’ revision worksheets.
Inspired by something I saw on Twitter, I have spent today creating a series of ‘Check 20’ revision worksheets for AQA Geography. Paper 1 complete, Paper 2 in progress. Find them here: https://t.co/cDN3mIn9DS
Nice, straightforward example of a knowledge organiser by @TweetcherT.
My first ever knowledge organiser from scratch. It’s far from perfect but what have I learned?
1. It’s MUCH easier making these from a blank page than it is editing someone else’s work.
2. Using @olicav‘s rules of “cut, chunk, align, restrain” makes for an overall better look. pic.twitter.com/94LWnfF7Ch
Take a look at this great blog post on cognative load theory by @sarahlarsen74.
⬇️⬇️ New post! How Cognitive Load Theory has changed my teaching. Cutting out jazzy tasks and refocusing my planning, execution and feedback. ⬇️⬇️https://t.co/Lohg1vtDEo
Live modelling using Powerpoint is easy with this guide by @mrwmhistory.
Sunday blog post – this time on ‘Live Modelling’ using some hidden features of powerpoint. This has revolutionised my teaching (particularly of exam questions) in the last few years. Fully downloadable resource and instructions for getting started! https://t.co/61DthVMevb
Take a look at this simple, attractive graphic organiser by @_jopayne
Experimenting with @olicav advice on graphic organiser mind maps with the Boscastle flood case study. Yes, I know it is old, but always a memorable one. New OCR B textbook being updated with Storm Desmond, so I will enjoy this one for a little longer! #geographyteacherpic.twitter.com/dquqfETsLY
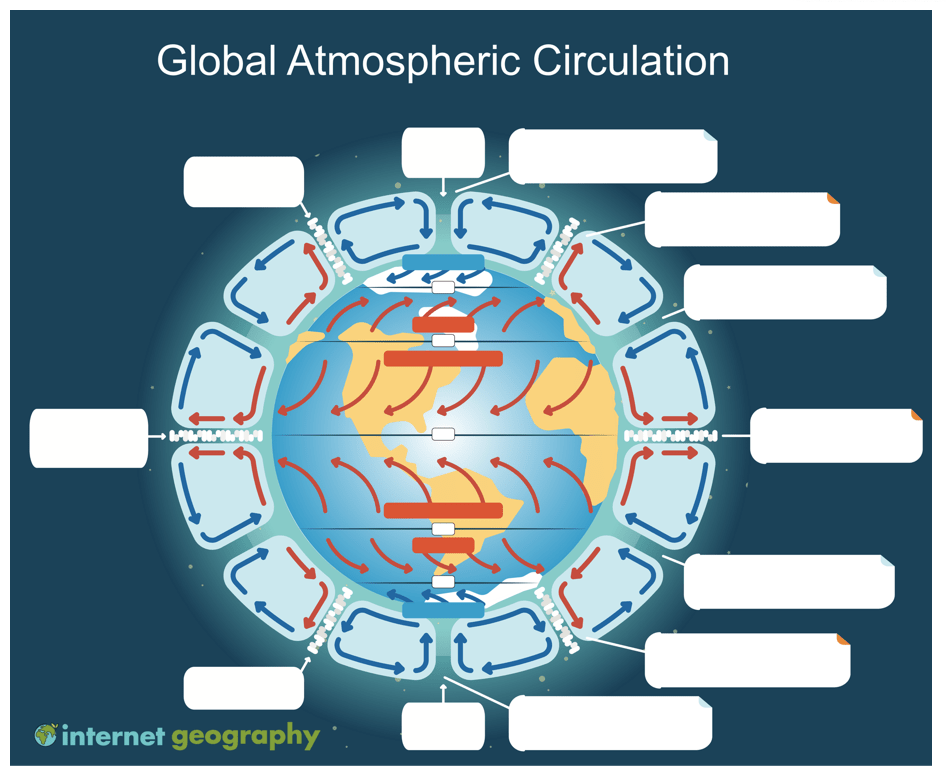
Diagrams from memory are a great way to revisit prior learning. In this case, we’re sharing an unlabelled diagram of the global atmospheric circulation diagram. The idea is to display the labelled diagram for a short period of time to remind students of the key components of global atmospheric circulation. A simple quiz could be used to encourage the students to think about the features of the model and the processes that drive global atmospheric circulation. Following this, any misconceptions can be addressed before removing the labelled image from display.
Students then complete the blank diagram to demonstrate what they know. Scaffolding can be provided to the students who need it through providing additional annotations or the first letter of each label.
Google Maps has been around for over 10 years now. The free GIS software is easy to use and allows students to collaborate in real-time. We’ve pulled together 8 ways of using Google My Maps in the classroom.
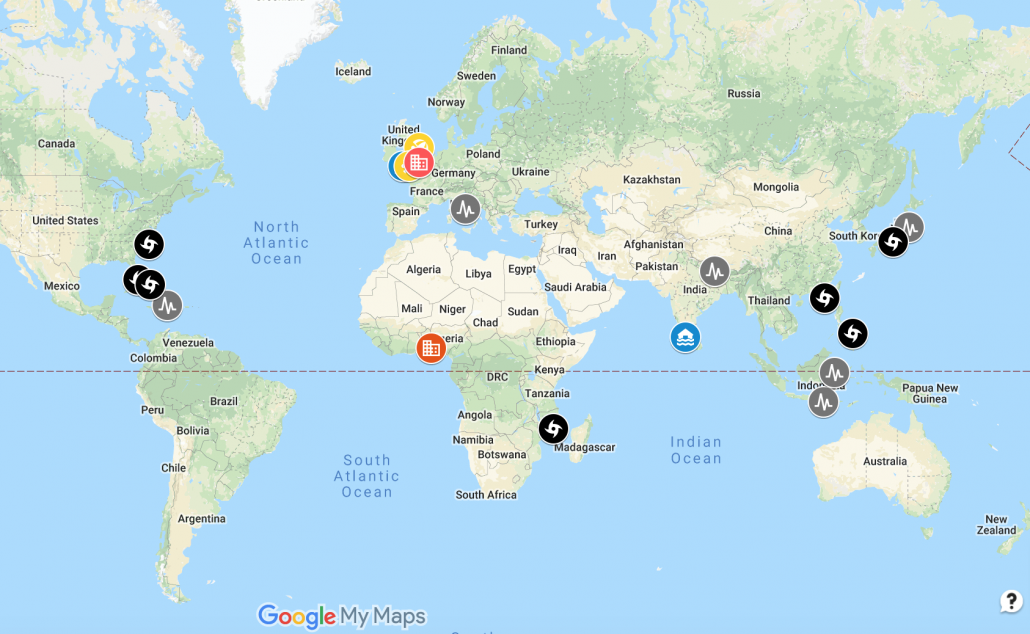
1. Case study maps
Google My Maps is a great way of collating and displaying case studies in one place. They are a great tool to use for revising case studies. Students can collaborate on revision maps and add text, images and videos to pins for each case study. We’ve put together a tutorial that students can use to create a case study map.
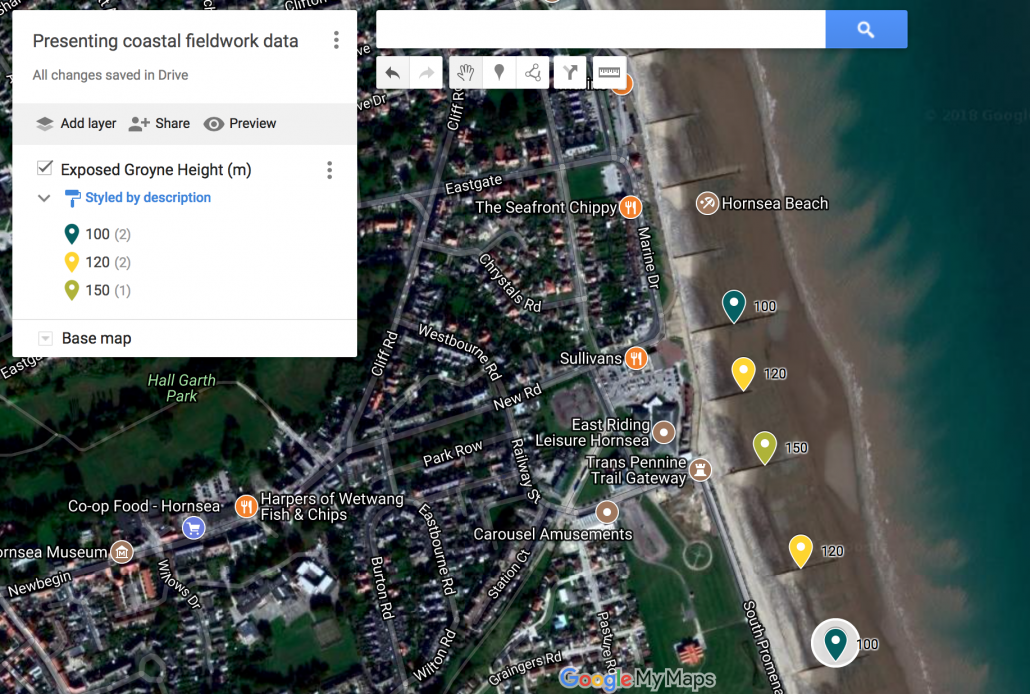
2. Presenting coastal fieldwork data
Completed map
Presenting data collected during a coastal fieldwork study is really simple on Google My Maps. For example, data collected as part of an investigation into the impact of groynes on longshore drift, can be easily presented on a satellite image. The up-drift and down-drift height of a beach can be plotted on pins to illustrate changes along the beach. Students will be able to see geospatial patterns in the data which they can then analyse. Take a look at our guide to presenting coastal fieldwork data.
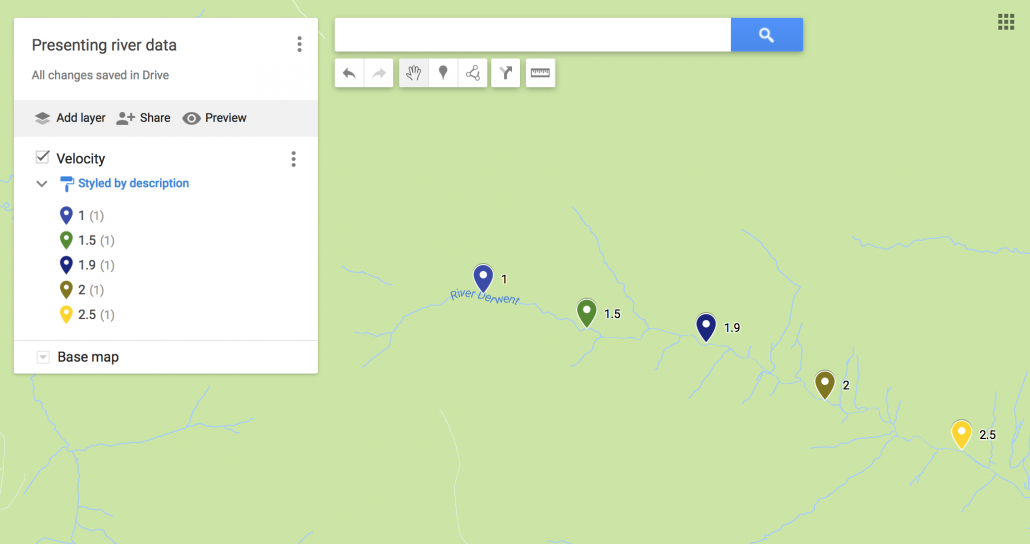
3. Presenting river fieldwork data
map with data on
As with coastal fieldwork data, it is really easy to present river fieldwork data on Google My Maps. Data such as wetted perimeter, discharge and velocity can be displayed at appropriate locations along the course of a river. Check out our guide to presenting river fieldwork data.
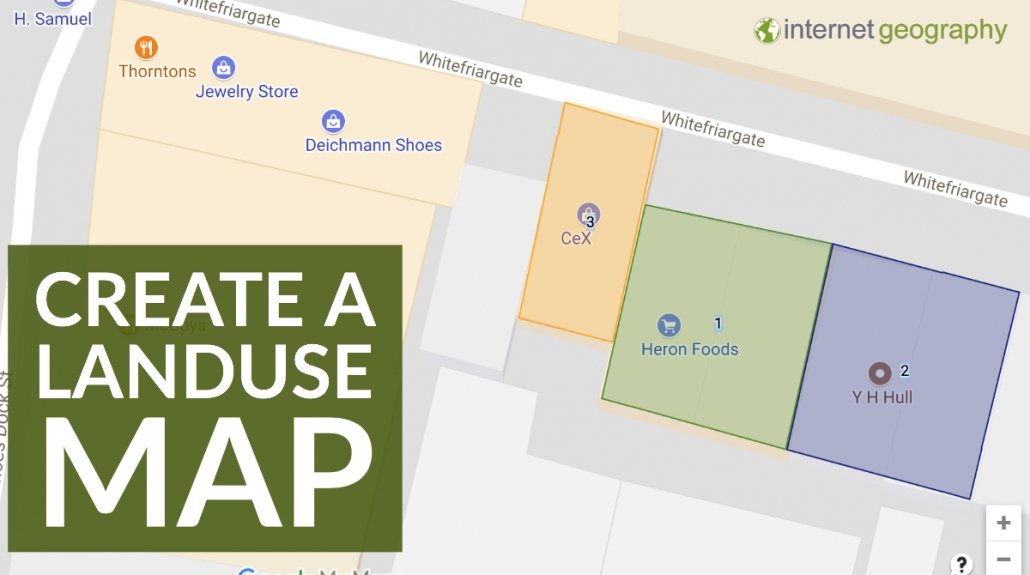
4. Landuse maps
Landuse maps are easy to create in Google Maps. Using the polygon tool shapes can be drawn on a layer over satellite images of your study areas. Find out how to create a landuse map in Google My Maps.
5. Measuring Distance
Google My Map has a powerful measurement tool that can be used to investigate distance on maps. It can be used in a range of ways including:
identifying locations that are equal distances apart for fieldwork e.g. river sampling locations
measuring the impact of coastal erosion
calculating the length of lava flows
calculating distance between places, both straight line and following a route
Using Google Images and Google Maps you can easily create a map using an album of geotagged photos. Geotagged photos are those that include data on the location they were taken. Most modern mobile phones have this feature as do some digital cameras. If you are not sure a quick search on the Internet will tell you if this option is available and how to enable it. Take a look at our guide to mapping photographs using Google My Maps.
7. Go on a scavenger hunt
It’s possible to search for locations using longitude and latitude. Why not give students a list of points via latitude and longitude and have them use Google My Maps to find out what each point is. You could also provide 3 locations and ask the students to work out what they have in common. They could examine each location using the satellite image layer to work out the physical and human characteristics the places have in common. Turn it into a game: the first student to figure them all out wins. Do this in small groups or as an independent activity, in class or for homework.
8. Plan a route
Students could use Google My Maps to plan a route. The purpose of the route could be to create an interactive tour to show the human and physical characteristics of an area.
https://www.internetgeography.net/wp-content/uploads/2019/10/8-Ways-to-Use-Google-My-Maps-In-Geography-.png6701200Anthony Bennetthttps://www.internetgeography.net/wp-content/uploads/2024/01/Internet-Geography-Logo.pngAnthony Bennett2019-10-21 14:47:512019-12-08 22:24:408 ways to use Google Maps in geography
This is the eighth collection of useful tweets relating to #geography and #geographyteachers. The world of Twitter can be a busy place so I’ve pulled together some tweet treats from the last week or so that are worth having a look at. Tweets are in no particular order.
As a school we have a knowledge rich curriculum so we can’t do much creative work. I said to my Yr7 students on top of their self quizzing if they wanted, they could do informative posters, where the best ones will get 100 house points. The response is amazing! #GeographyTeacherpic.twitter.com/eeCOiqXl4x
— Mrs_Geography 🌏 Kelly Peppin (@Mrs_Geography) October 16, 2019
*Questions for the Answers* This activity is brilliant. Not only does it allow me to see if Ss understand key concepts but also if they can make links. They have really got to THINK. I banned “poor quality questions”. #geographyteacherpic.twitter.com/dLHub7mamd
I’ve tracked down a quite few middle leaders in both DT and Art where their subject has been selected for a ‘Deep dive’ in a recent O inspection. I’ve been keeping some notes on what they have said to me… although these can be used for all subjects. You’re welcome 🙃. pic.twitter.com/DyFU2KQLIg
Expanding our ideas in Y10. Initial strategies about reducing desertification, expanded to how they work, expanded further to how they’re sustainable. Hopefully will help them structure exam questions too. My appalling writing, their ideas/feedback pic.twitter.com/SnNLAXAMWl
In this guest blog post Rayburn Tours share some great ways to spend time in Iceland on a budget. You can follow Rayburn Tours on Twitter via @RayburnEdu. Find out more about school trips to Iceland with Rayburn Tours.
Ok, it’s unlikely that a full on adventure to Iceland is going to be a cheap getaway, but this land of spectacular natural beauty has so much to offer visitors without breaking the bank. Any adventurer will be spoilt for choice with steaming hot springs, crashing waterfalls, glistening glaciers and powerful volcanoes – all of which are low-cost options.
So we’ve put together our top 10 recommendations for a school geography trip to Iceland that’ll leave your students wowed (without blowing the budget!).
1. Visit one of the local swimming pools
A nation of bathing lovers, Icelanders lap up swimming pools, hot tubs and natural springs. Often geothermally heated and surrounded by stunning scenery, make a splash on your adventure with a visit to a local swimming pool.
Whilst a visit to the Blue Lagoon is popular among tourists, there are plenty of cheaper alternatives. Whether you take a dip in one of Iceland’s oldest hot springs – the magical Secret Lagoon – or you dive into one of the many local pools, a swim is a must on any Iceland bucket list.
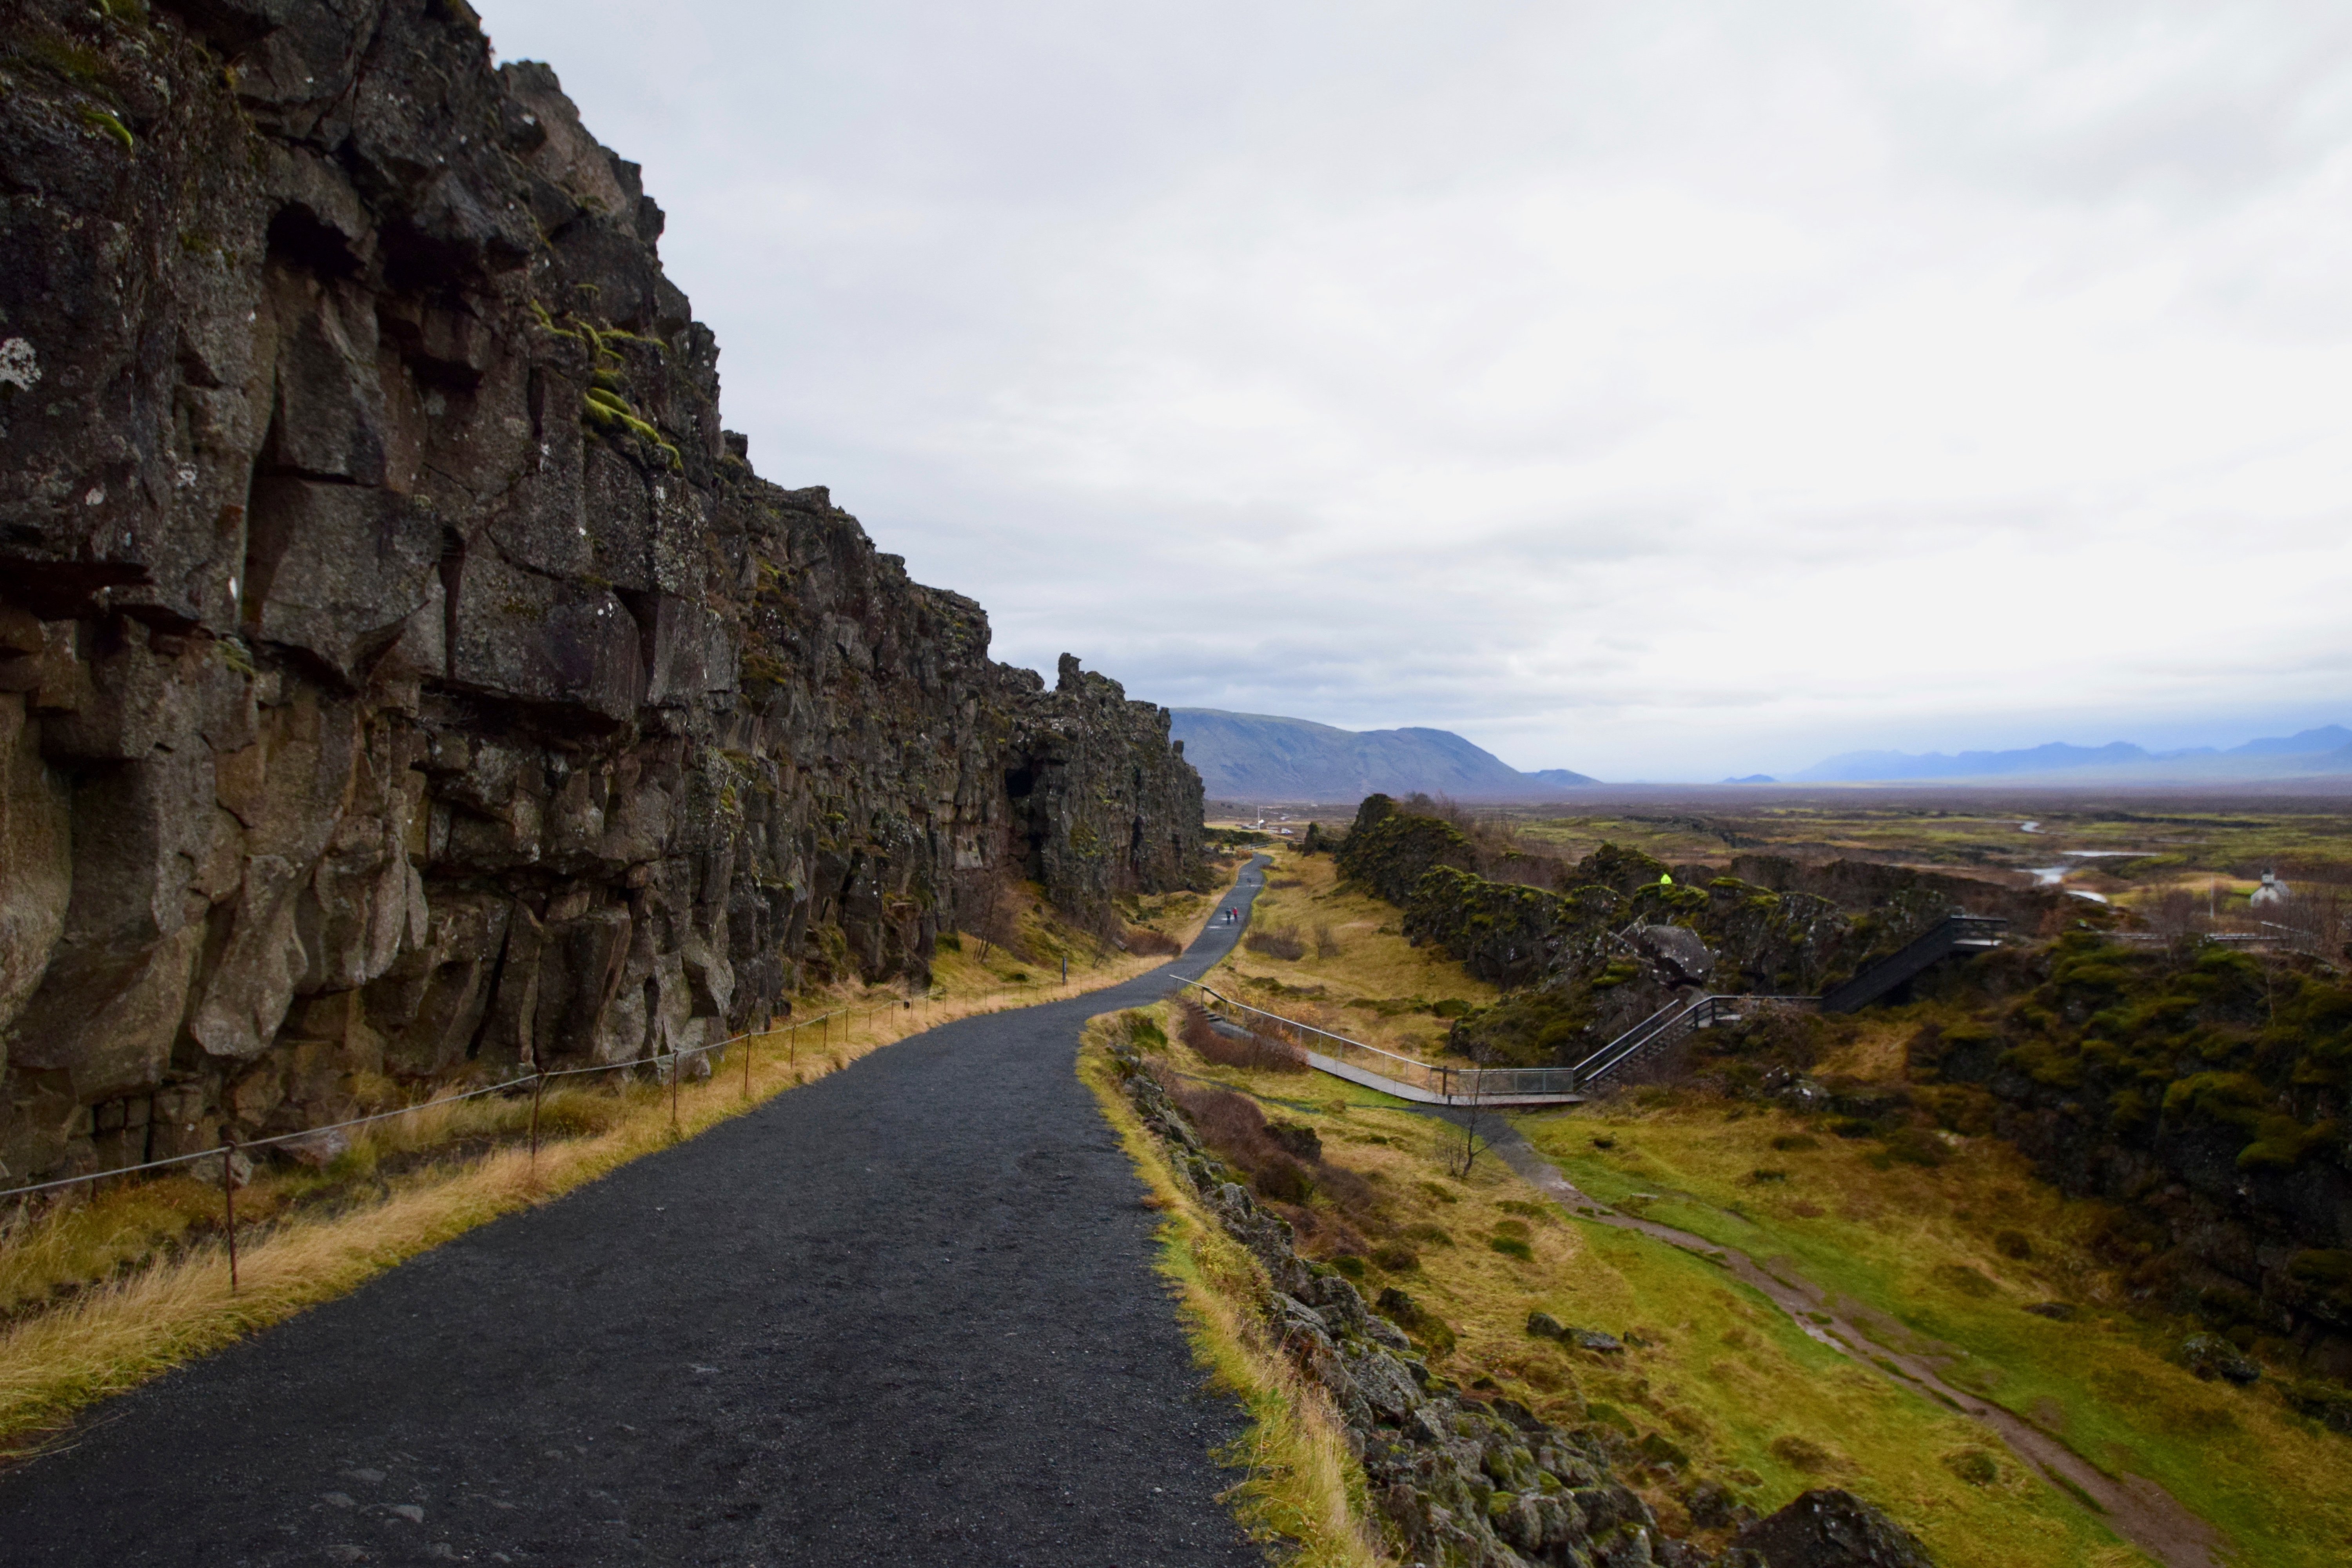
2. Walk along the boundary of the North American & Eurasian plates at Thingvellir
Pingvellir National Park, home to ‘The Wall’ from Game of Thrones
As one of Iceland’s most significant historical sites and part of the country’s famous Golden Circle tour, Thingvellir National Park is not to be missed. It’s one of the few places on earth where the Mid Atlantic Ridge is visible above sea level. Here you can venture between the rifts in the earth’s crust at the boundary of the Eurasian and North American tectonic plates.
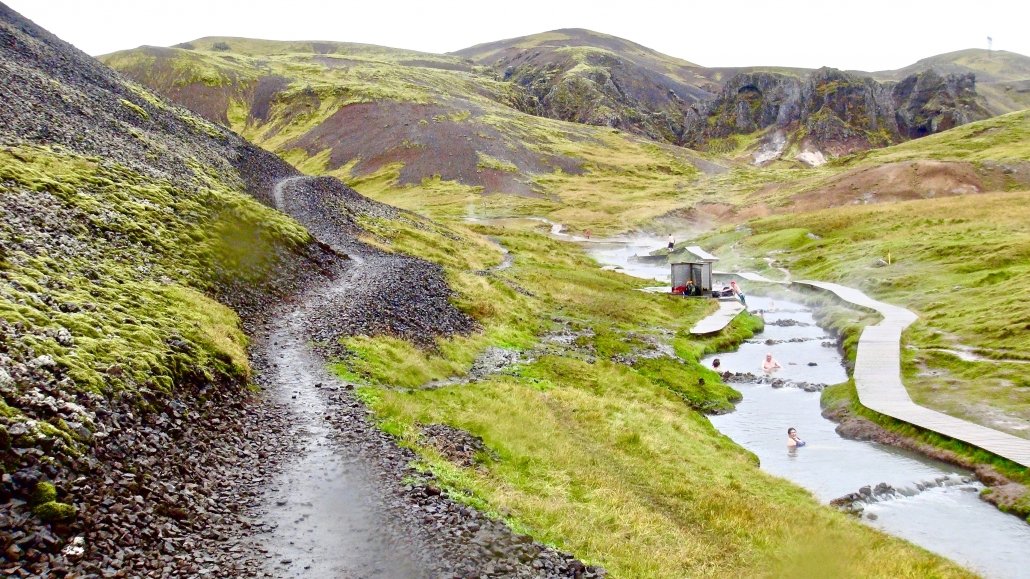
3. Experience hot springs and the hot river near Hveragerdi
Iceland, Reykjadalur hot springs, Hveragerdi
The hot spring town of Hveragerði boasts an active geothermal area right in the centre of town. Whether you choose to take a dip in the hot river, or boil eggs and bake bread in the hot springs, there’s something to keep everyone entertained. Take a hike along one of the many walking trails and admire the surreal landscape, where white plumes of water vapour surge up into the sky from the surrounding hills.
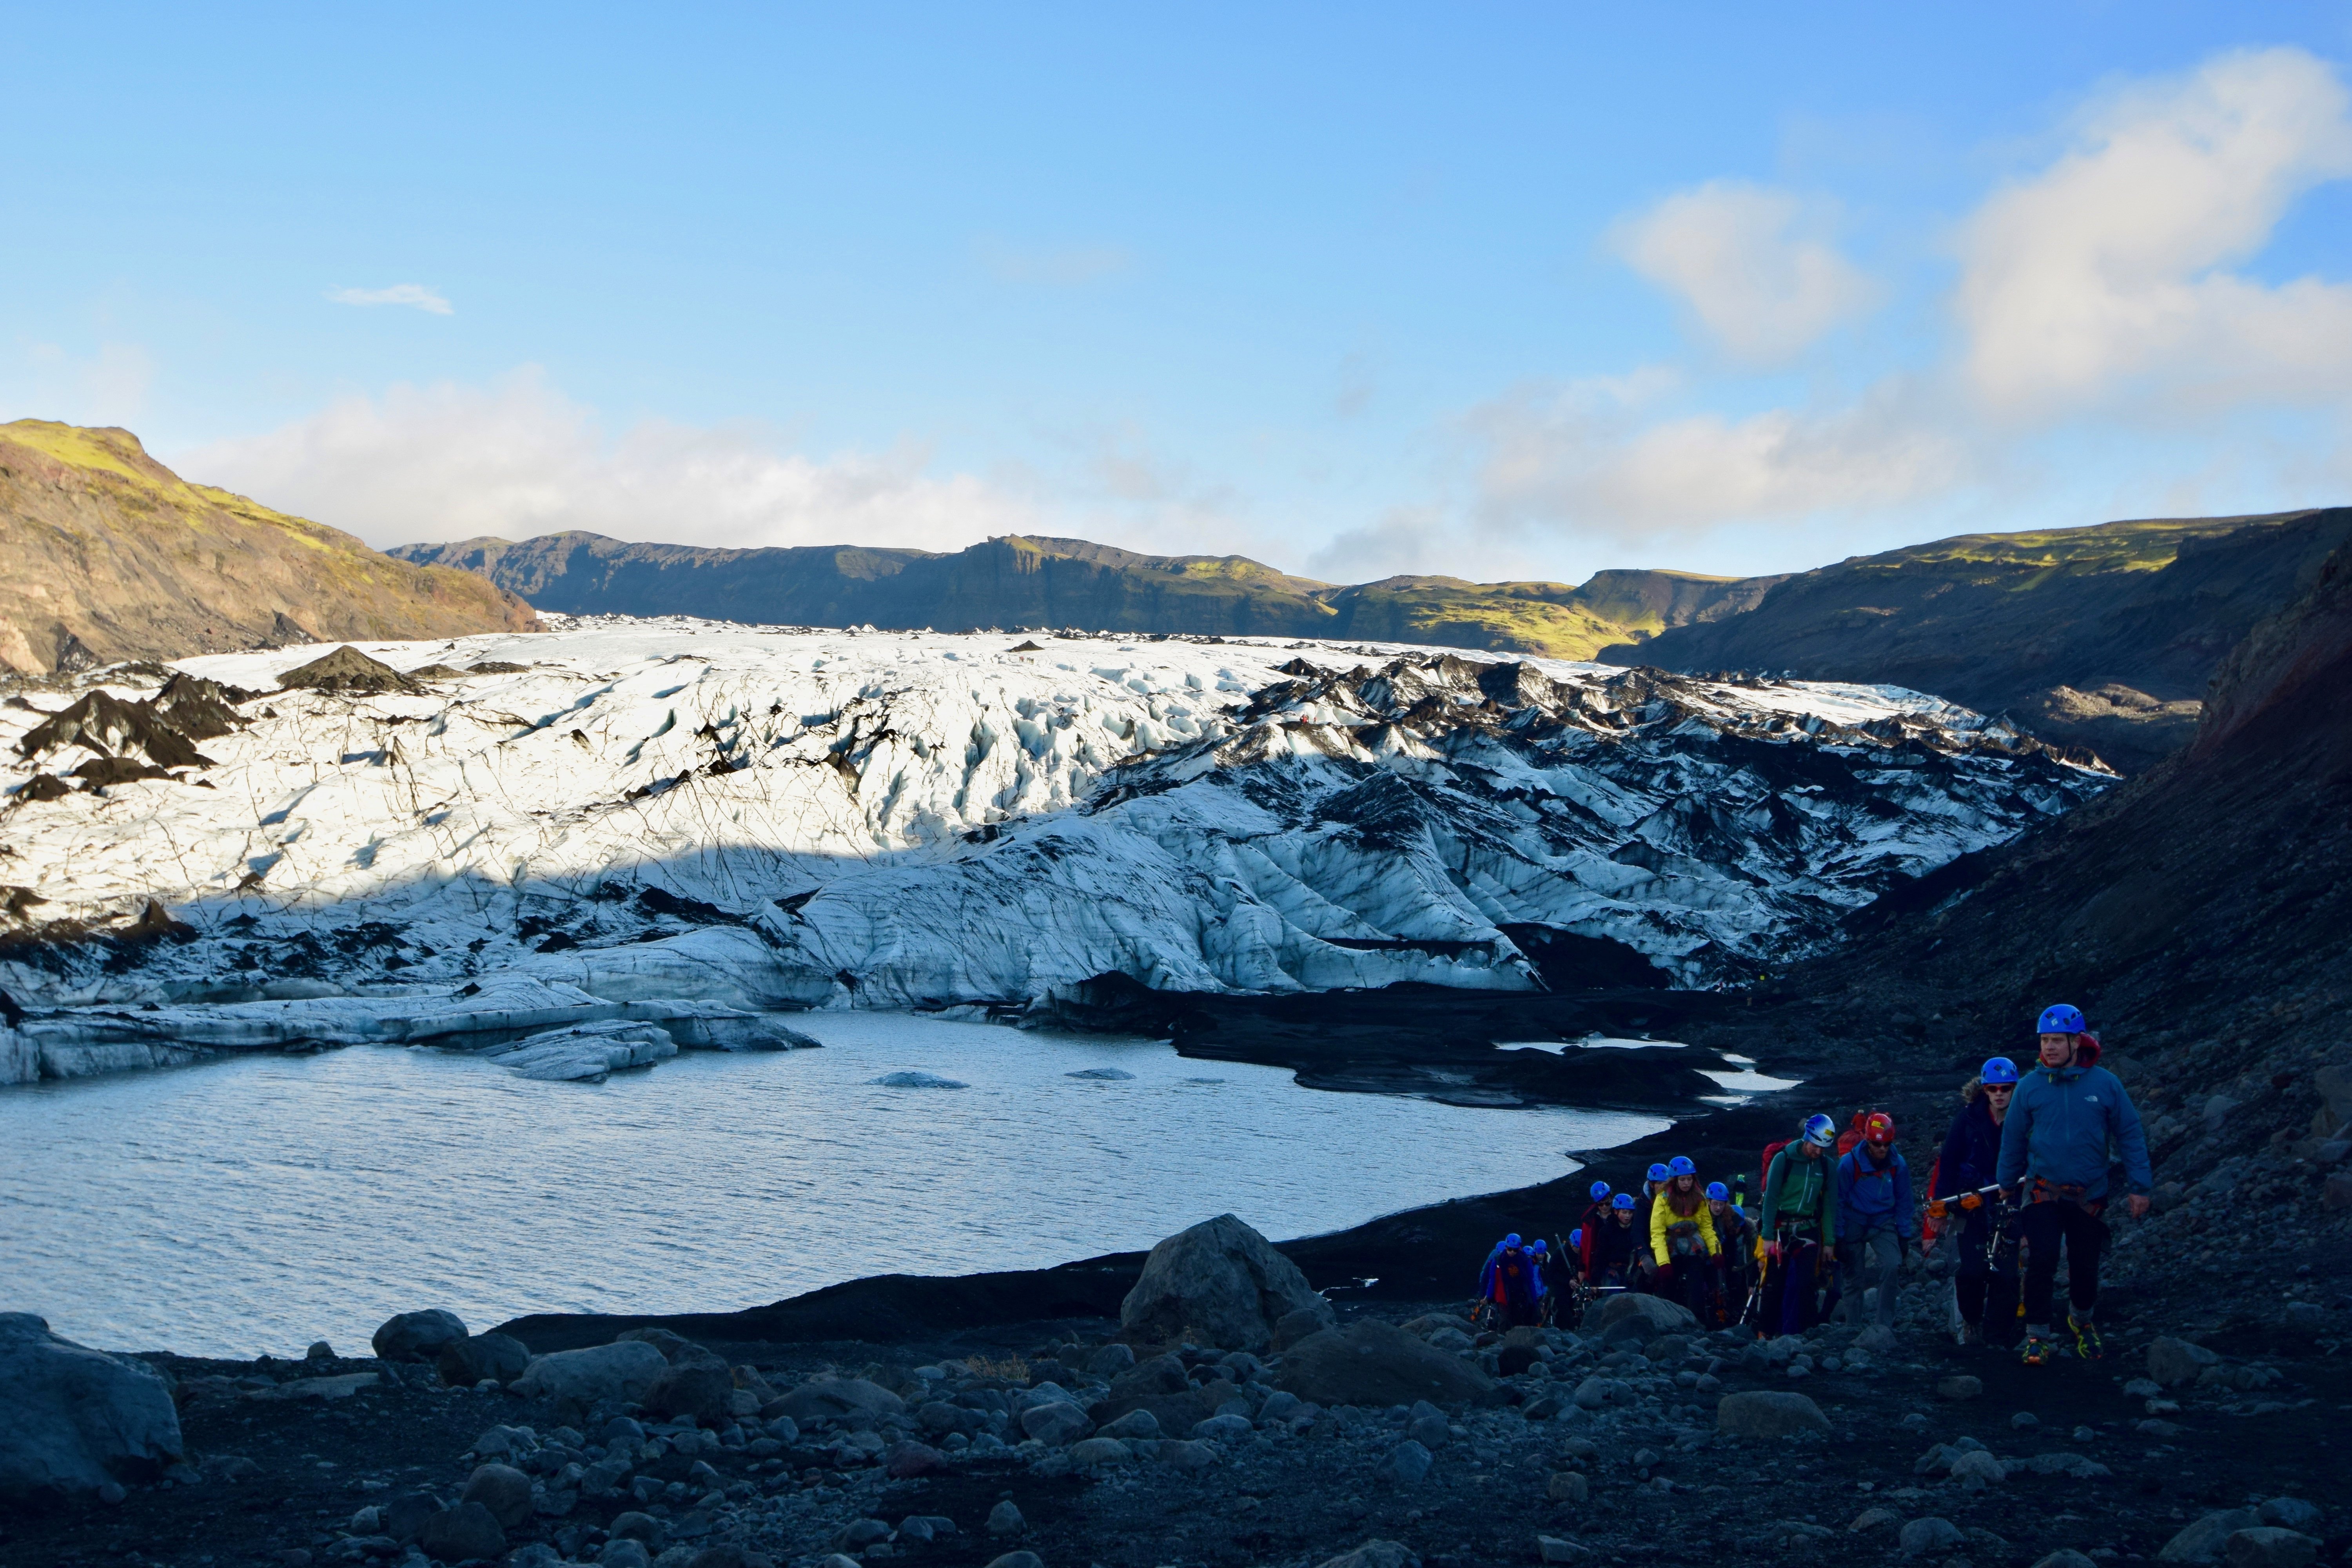
4. Witness glaciers before they disappear
Sólheimajökull Glacier
Iceland’s glaciers are a sight to behold and with the loss of the country’s first glacier – Okjökull– earlier this year, witnessing one of the remaining rivers of ice is all the more meaningful. With approximately 11% of the country’s landscape covered by ice caps, the remaining retreating glaciers bring home the effects of climate change and the importance of preserving these rivers of ice.
Whether you witness Iceland’s largest glacier, the mighty Vatnajökull, Snæfellsjökull or Langjökull, your students are certain to be blown away by the natural beauty.
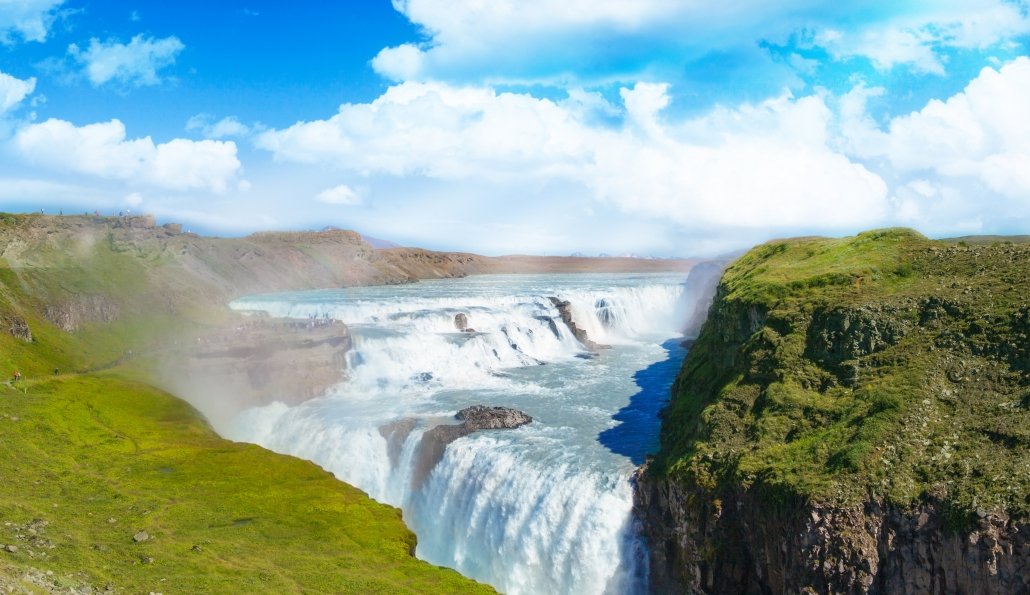
5. Don’t Do go chasing waterfalls!
Gulfoss waterfall
If you’re wowed by water then Iceland’s numerous crashing falls are sure to impress. What’s even more thrilling is that glacial runoff is continually causing new waterfalls to form! Iceland has many striking splendours to enjoy, but some of our favourites are Gullfoss, Seljalandsfoss and Skógafoss. For those looking to venture off the beaten track, the lesser known Gluggafoss, Faxafoss, Urridafoss will hit the spot.
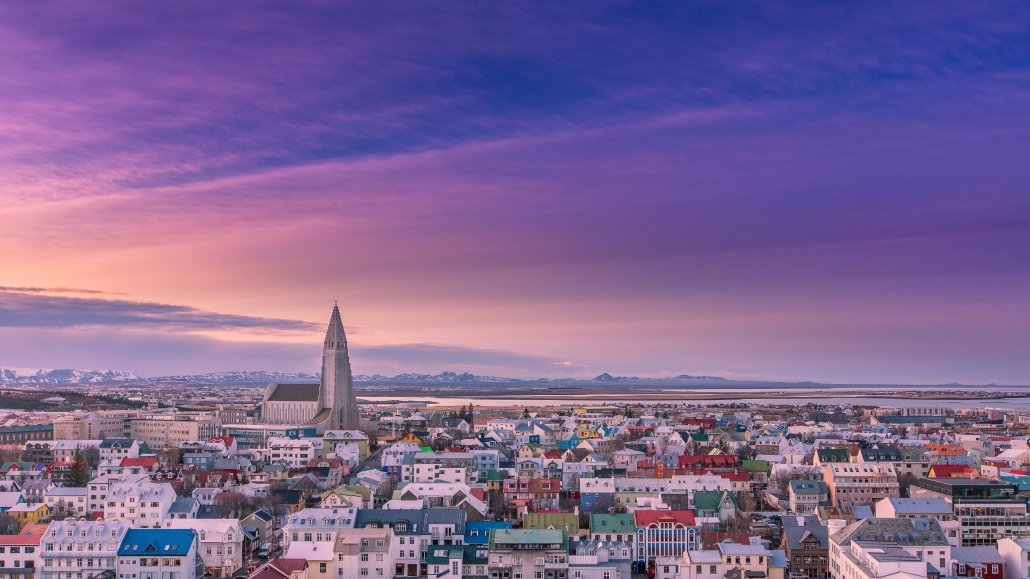
6. Spend time exploring Reykjavik
Reykjavik
As the world’s most northerly capital city, artsy Reykjavik is the perfect place to take some time out to explore. Meander along the streets; taking in the colourful buildings and contrasting architecture, before looking out across the rugged hills.
Whether you join a free walking tour of the city, head up to the top of the Hallgrímskirkja for stunning city views or take a boat ride from the harbour, there’s plenty to experience in this coastal city.
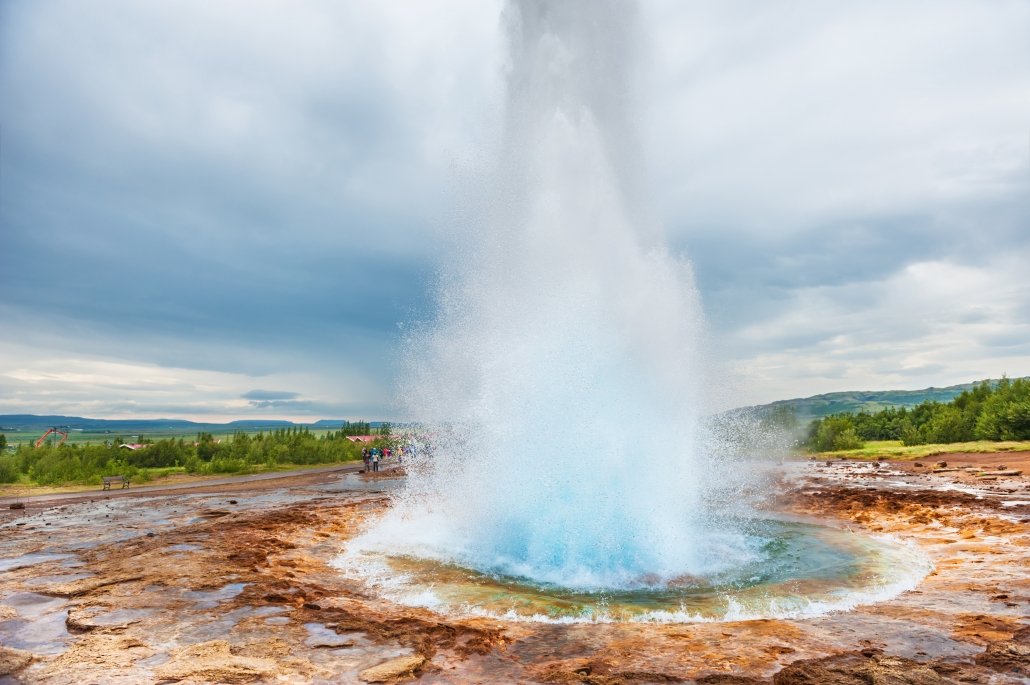
7. Behold Geysir erupting
Eruption of Strokkur Geysir, Golden circle route in Iceland
As one of the visits on the Golden Circle tour, Geysir Geothermal Area is one of Iceland’s most famous tourist attractions and it’s easy to see why. No visit to Iceland would be complete without witnessing (and maybe even taking a boomerang of) Strokkur Geysir shooting boiling water tens of metres high into the air.
Home to various other hot springs, bubbling mud pools and lively eruptions, you’ll also find the original geyser, ‘Great Geysir’. Although Great Geysir’s eruptions are rare, it can eject steam up to 80 metres in the air.
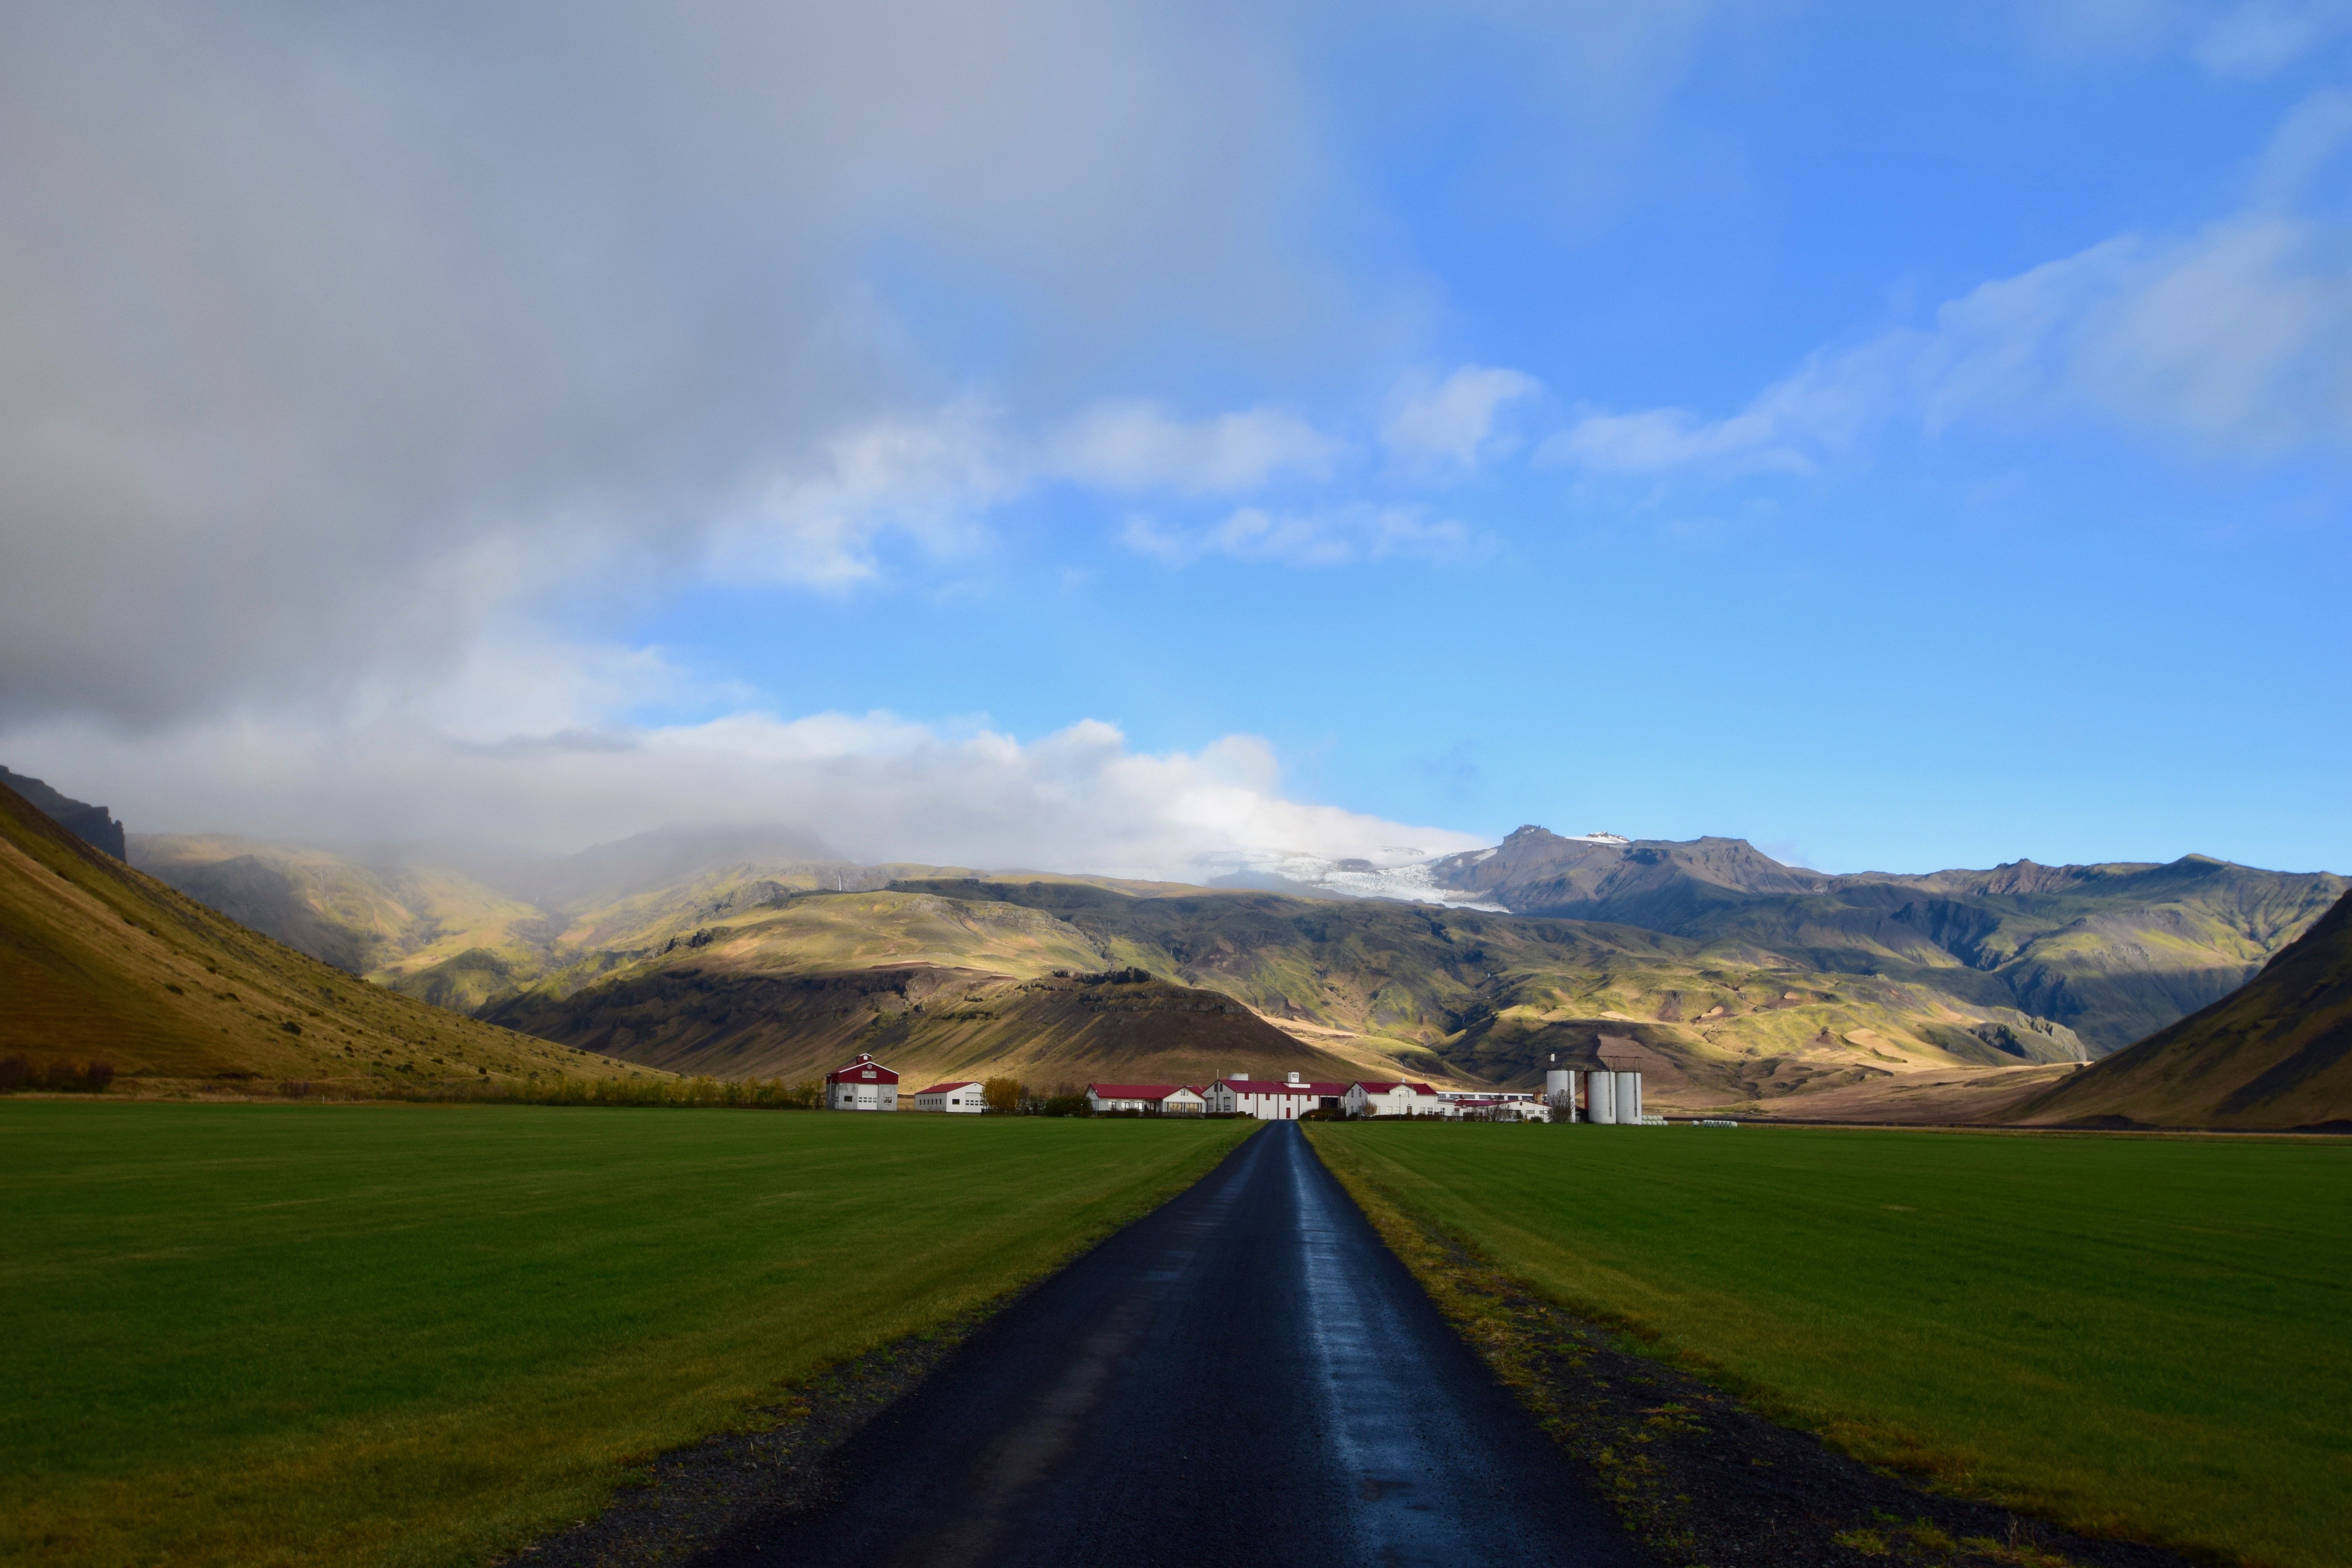
8. Find out about the eruption of Eyjafjallajokull and Iceland’s other volcanoes
Eyjafjallajökull
Iceland is well-known for its explosive volcanoes and the Katla Centre, overlooked by Eyjafjallajokull, is the perfect place to get all fired up about these explosive formations. Focusing on the Katla volcano which sits under Mýrdalsjökull glacier, you’ll examine the different types of ash and volcanic rocks and learn about the significant impact the volcanic activity has had on the area.
9. Sample some local delicacies
Showcase of different ice cream in metal tubs, closeup
Whilst visitors to Iceland may find whale and shark a little bit fishy (in every sense), there are other local favourites that are definitely worth a try. Icelanders are particularly proud of their hot dogs and ice cream – certain to get your students vote.
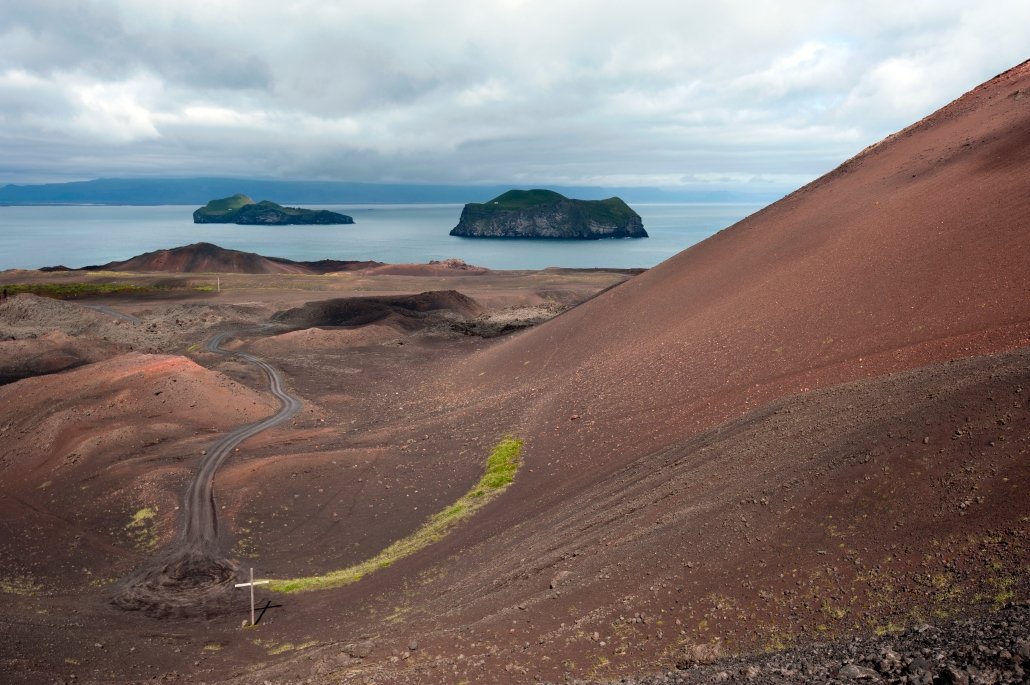
10. Take the ferry to Heimaey
The view from Eldfell volcano on Heimaey island, Iceland
All aboard for a visit to Heimaey! The largest and only inhabited island of the Westman Isles is only a 35-minute ferry ride from mainland Iceland. Island life was transformed following a major fissure eruption in 1973, and nowadays visitors can appreciate the devestating impacts by walking across the recently formed lava fields and climbing the newly formed Eldfell volcano.
The interactive Eldheimar Museum, built around one of the homes uncovered from the ash, tells the story of the eruption and includes an exhibition on the Surtsey eruption – the island that emerged from the ocean in 1963.
Find out more about school trips to Iceland with Rayburn Tours
https://www.internetgeography.net/wp-content/uploads/2019/10/Geysir-scaled.jpg10651600Anthony Bennetthttps://www.internetgeography.net/wp-content/uploads/2024/01/Internet-Geography-Logo.pngAnthony Bennett2019-10-17 19:15:572019-10-16 16:33:04Top 10 best things to do in Iceland on a budget
This is the seventh collection of useful tweets relating to #geography and #geographyteachers. The world of Twitter can be a busy place so I’ve pulled together some tweet treats from the last week or so that are worth having a look at. Tweets are in no particular order.
Following advice from @teacherhead here: https://t.co/QPilLPqq3f I gave Ss the choice of what to research & how to present their homework. The result? They’ve all explored one in-depth example of a development gap cause, but their agency yielded superb efforts across the board! pic.twitter.com/6gmp34ZI0D
My go to plenary to get students to evaluate (without explicitly knowing it), involves the whole class and then stems a final class discussion. This was the evaluation of a bottom up development scheme, I’ll repeat this next lesson for top down and it will allow us to compare pic.twitter.com/qCD7rK3VBu