Tweet Treats #8
This is the eighth collection of useful tweets relating to #geography and #geographyteachers. The world of Twitter can be a busy place so I’ve pulled together some tweet treats from the last week or so that are worth having a look at. Tweets are in no particular order.
Tried out Ripple effects from the @geogchat newsletter last week. Interesting ideas here @m_chiles, keen to get this embedded in the future. #teamgeog pic.twitter.com/7gOcjWBTp0
— Paul 🌎 (@ploguey) October 20, 2019
As a school we have a knowledge rich curriculum so we can’t do much creative work. I said to my Yr7 students on top of their self quizzing if they wanted, they could do informative posters, where the best ones will get 100 house points. The response is amazing! #GeographyTeacher pic.twitter.com/eeCOiqXl4x
— Miss C (@MissTC19) October 18, 2019
Hi all! You can download my lesson here for FREE. Now live on TES 🙏🏻 Happy Friday! #geographyteacher https://t.co/Y2oOEeUtTf… pic.twitter.com/xQFFf8qDe8
— Mrs Reed (@MrsReedGeo) October 18, 2019
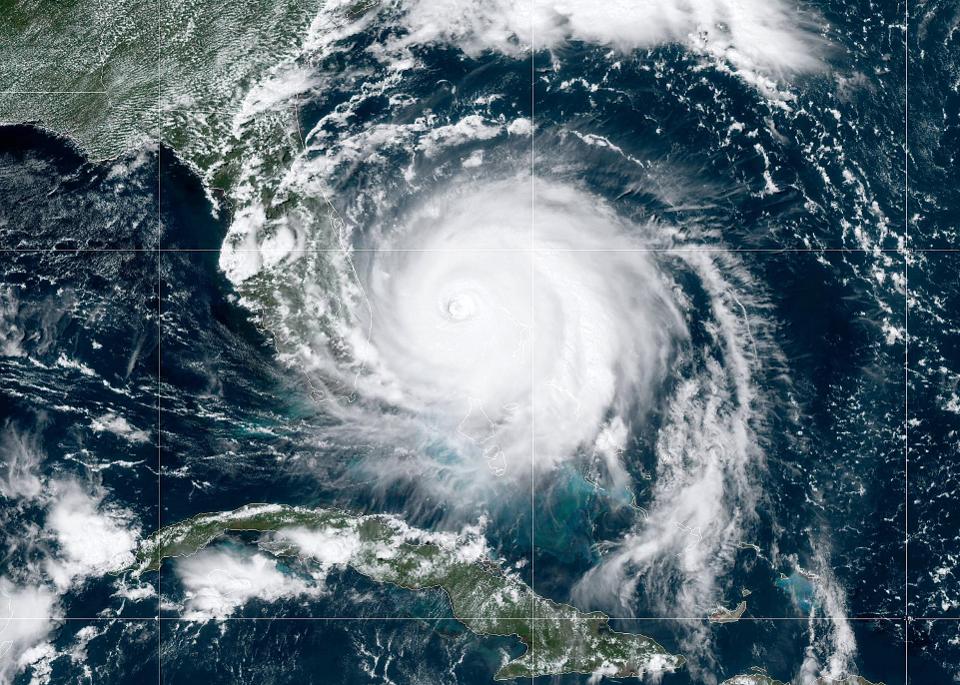
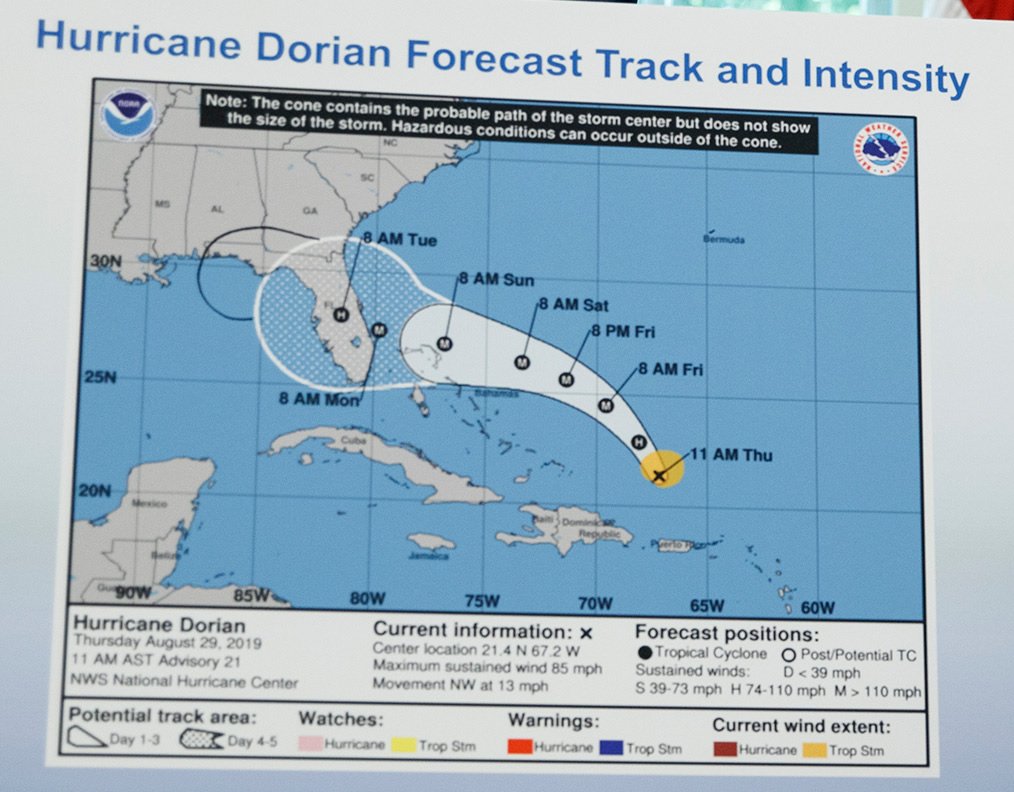
YR10 creating tropical storm mocktails last week #geographyteacher @greenbankhs pic.twitter.com/7xUoaOvah1
— Mrs_Geography 🌏 Kelly Peppin (@Mrs_Geography) October 16, 2019
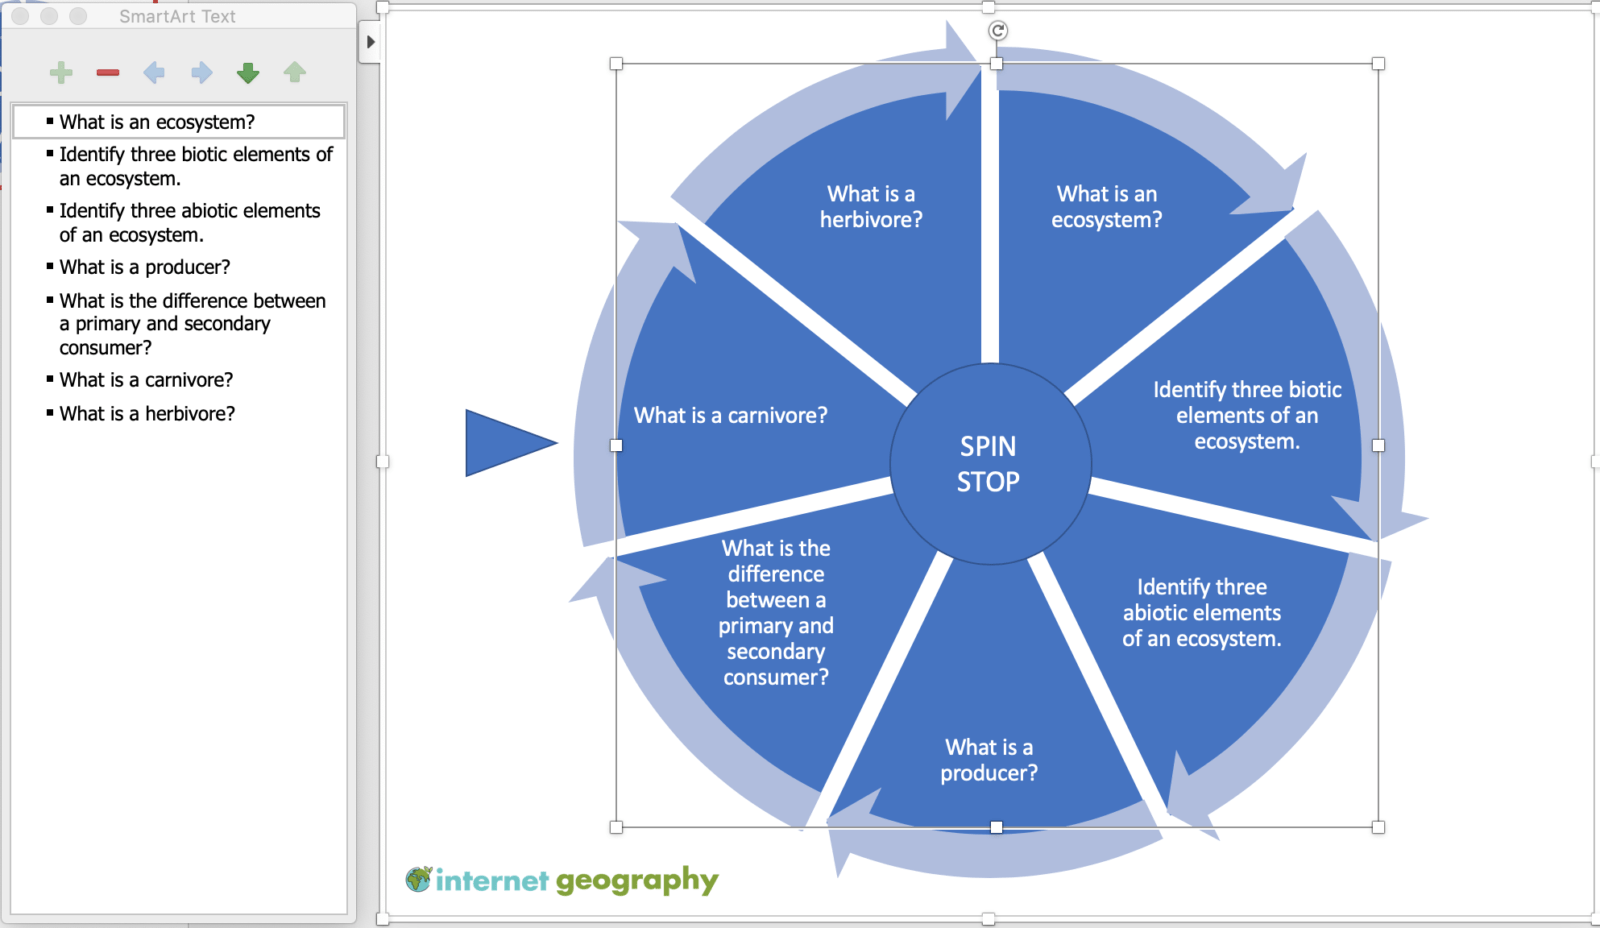
*Questions for the Answers* This activity is brilliant. Not only does it allow me to see if Ss understand key concepts but also if they can make links. They have really got to THINK. I banned “poor quality questions”. #geographyteacher pic.twitter.com/dLHub7mamd
— Mrs Reed (@MrsReedGeo) October 16, 2019
I’ve tracked down a quite few middle leaders in both DT and Art where their subject has been selected for a ‘Deep dive’ in a recent O inspection. I’ve been keeping some notes on what they have said to me… although these can be used for all subjects. You’re welcome 🙃. pic.twitter.com/DyFU2KQLIg
— Joanna (@Jxanna91) October 15, 2019
Expanding our ideas in Y10. Initial strategies about reducing desertification, expanded to how they work, expanded further to how they’re sustainable. Hopefully will help them structure exam questions too. My appalling writing, their ideas/feedback pic.twitter.com/SnNLAXAMWl
— Nicole (@nlcgeog) October 15, 2019
*** NEW POST ***
We can stand down – I have finally cracked the question on the purpose of education (or school, anyway).You are welcome. https://t.co/rsdl46lTaQ
— Mark Enser 🌍 (@EnserMark) October 20, 2019
Are Rosenshine’s Principles “just common sense”? #rED19 https://t.co/CsdIfJW4he > links to #rEDSurrey talk yesterday
— Tom Sherrington (@teacherhead) October 20, 2019
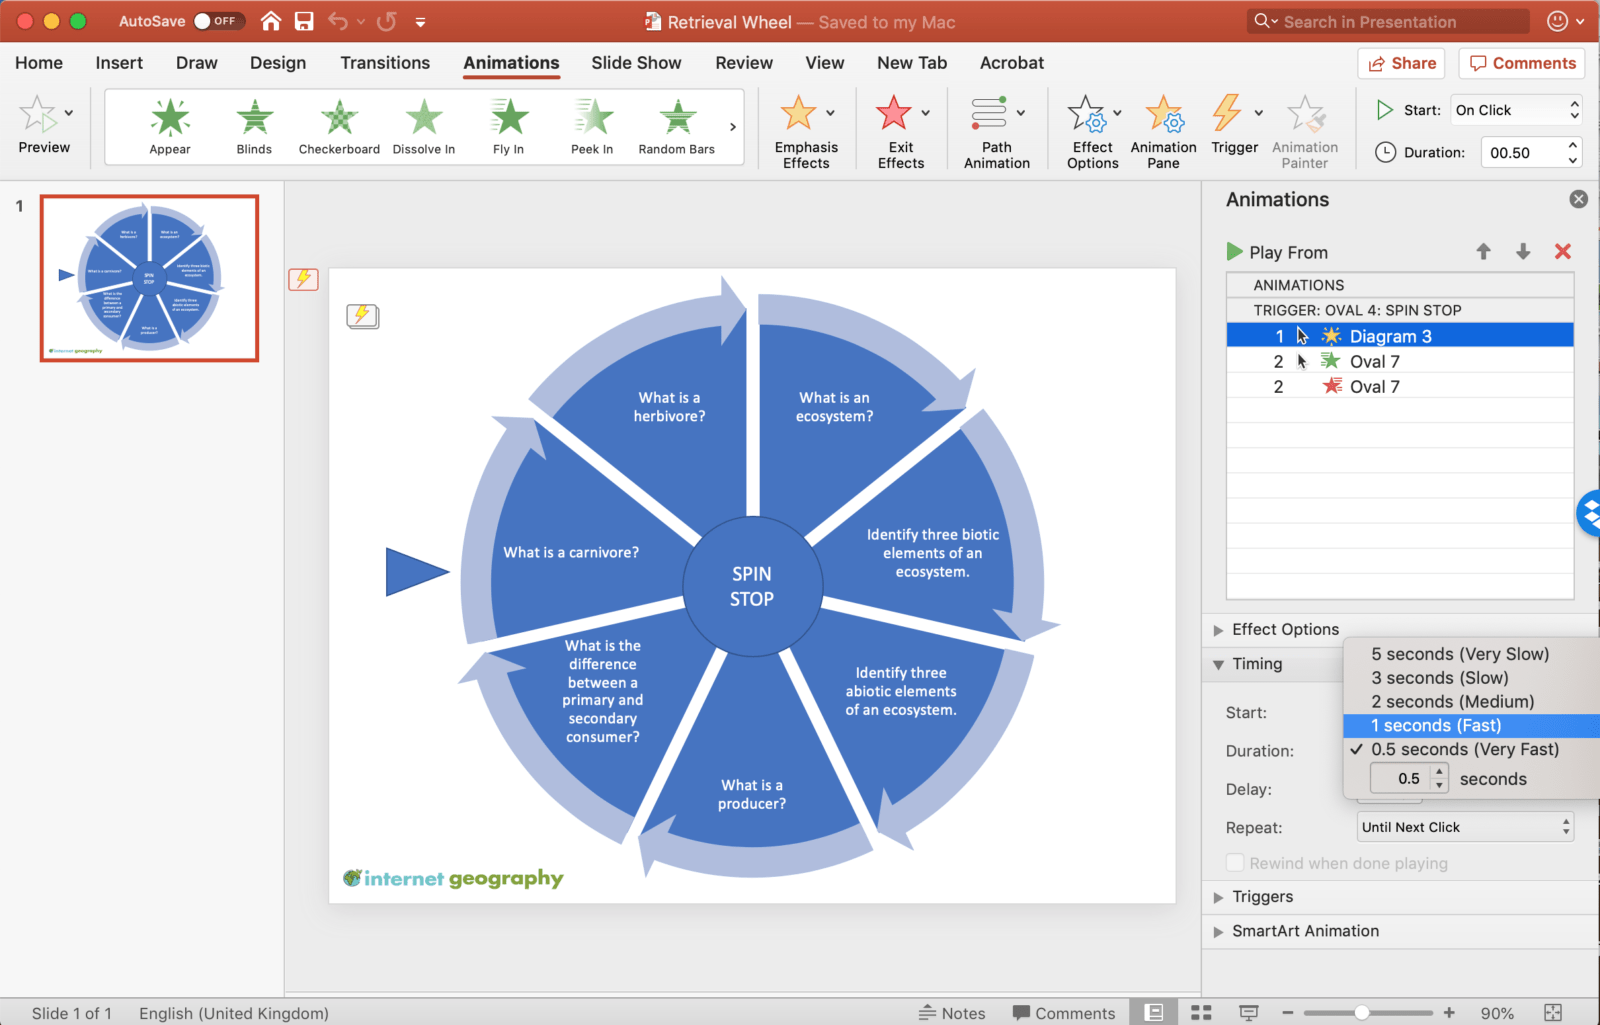
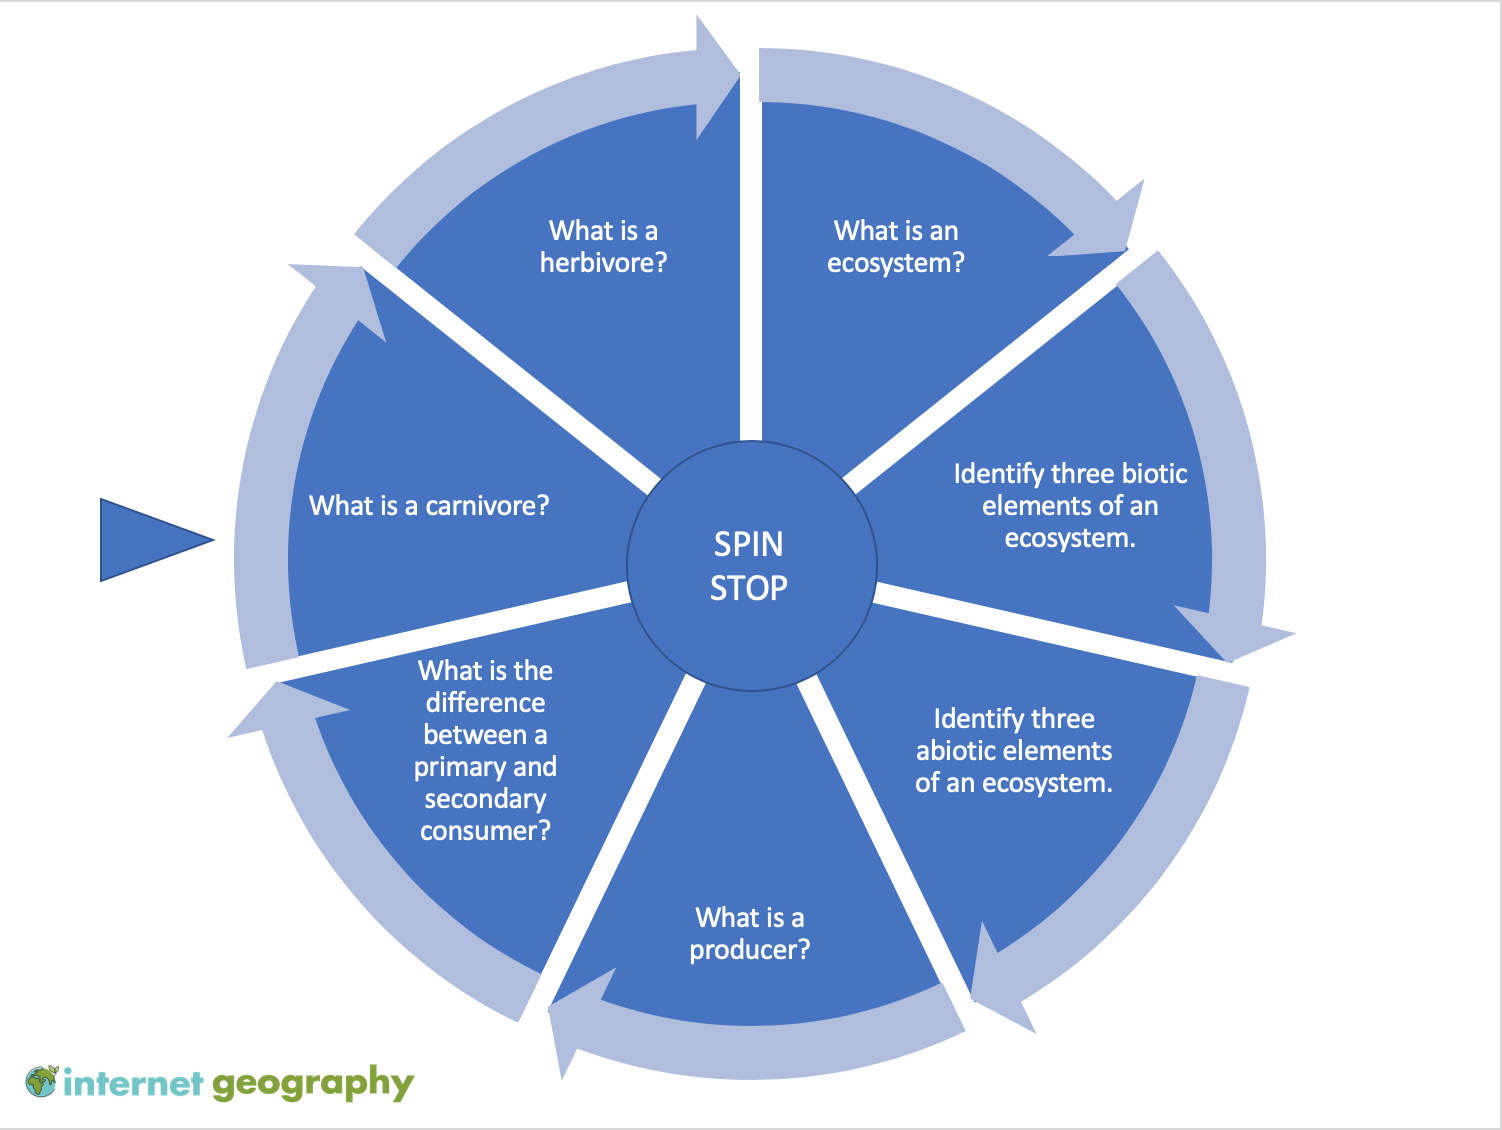
Absolutely LOVED making these. They’re going to be so useful for my y11s who struggle with the retention of key facts/statements. Thank you @missgeog92 for the inspiration #geographyteacher #edutwitter pic.twitter.com/iYbbdIlk8L
— Miss M Geog (@MissMcGowanGeog) October 19, 2019
Finally had the opportunity to use @GeoNewbz pop-up global atmospheric circulation temple. A clear and creative way to illustrate this complex concepts #geographyteacher @greenbankhs pic.twitter.com/Yg1a2EM2fy
— Mrs_Geography 🌏 Kelly Peppin (@Mrs_Geography) October 17, 2019
Year 10 enjoyed trialling these knowledge organisers this week #geographyteacher pic.twitter.com/HaR1dF3MTt
— Miss Scorer🌍 (@HannahRebekah17) October 17, 2019
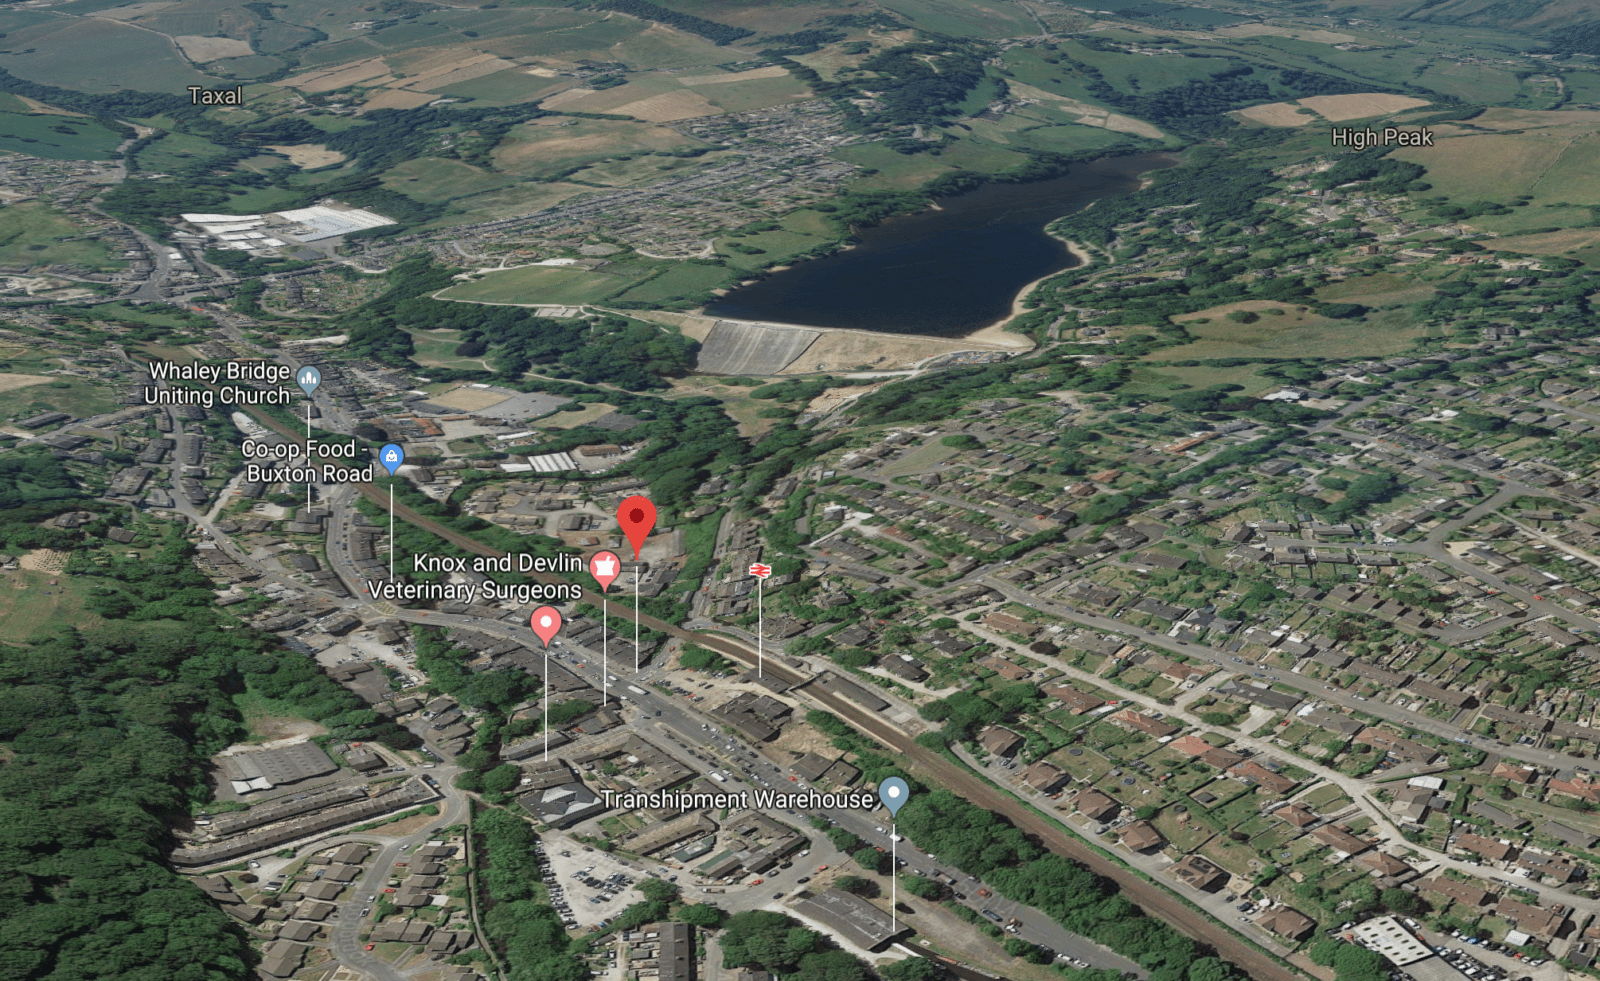
Create a case study map in Google Maps. It’s easy with this guide: https://t.co/euN8K9VSNr #geographyteacher pic.twitter.com/YJbloEOFqk
— internetgeography.net 🌍 (@InternetGeog) October 20, 2019
Map skills and disease dilemmas! Year 7 lesson in the planning to shake up our SOW. Will upload to TES if anyone is keen. #geographyteacher #mapskills pic.twitter.com/jmSa4eLaP3
— Mrs Reed (@MrsReedGeo) October 17, 2019
Planning my first ever starter activity for year 7s… they still like Fortnite, right? 🤷🏻♀️ #pgce #geographyteacher pic.twitter.com/bGYXFHJfDk
— Miss Brown (@geog_brown) October 15, 2019