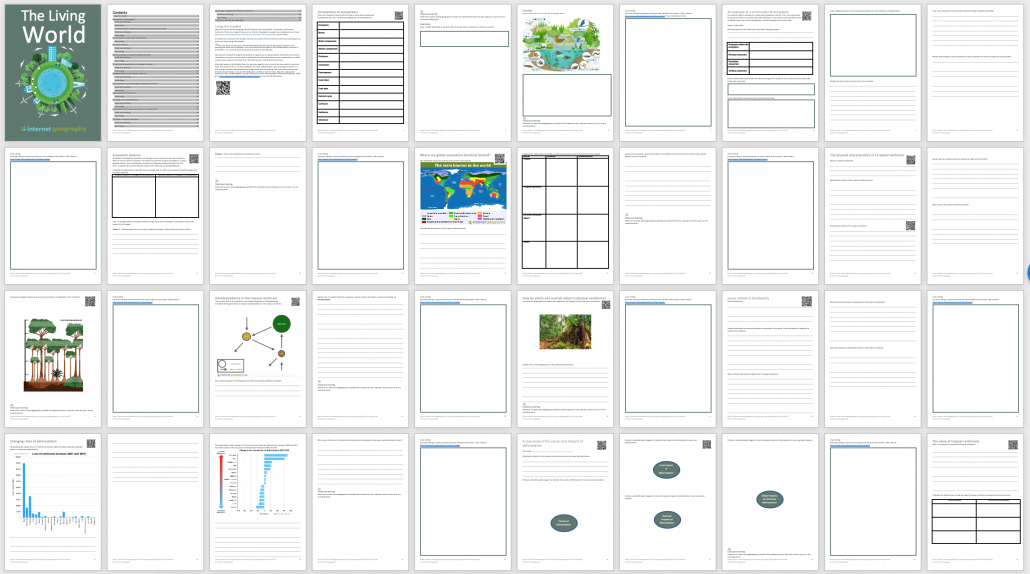
We recently ran a poll on Facebook and Twitter to find out what Internet Geography Plus subscribers wanted adding to the subscription area. Fifty-four per cent of Twitter respondents wanted to see the development of work booklets as did the majority of Facebookers. As a result of this, we are pleased to launch the first Internet Geography Plus work booklet!
Our first, fully editable work booklet covers ecosystems and tropical rainforests as part of the AQA GCSE Geography Living World unit (hot and cold environments will be published separately). The booklet can be used during class teaching, as a catch-up resource for students who missed the unit or as an opportunity to re-visit learning throughout the course, either in class or for homework.
Not only does the booklet include activities it also contains:
QR codes linking to online resources to support learners
links to online quizzes so students can check their learning
space for students to complete dual coding at the end of each section to summarise their learning, along with online resources to support learners complete this
Booklets covering each unit of the AQA GCSE Geography course will be added this term and are free to Internet Geography Plus subscribers. Log in to download the booklet now. Not a member? You can take out a low-cost subscription here.
UPDATE – 10/11/2019
We’ve uploaded a large number of work booklets for AQA and Edexcel A GCSE. For AQA these include:
The Changing Economic World
The Challenge of Natural Hazards – Climate change
The Challenge of Natural Hazards – Tectonics
River Landscapes in the UK
Coastal Landscapes in the UK
Ecosystems and rainforests
Ecosystems – cold environments
Ecosystems – hot deserts
For Edexcel A you can download:
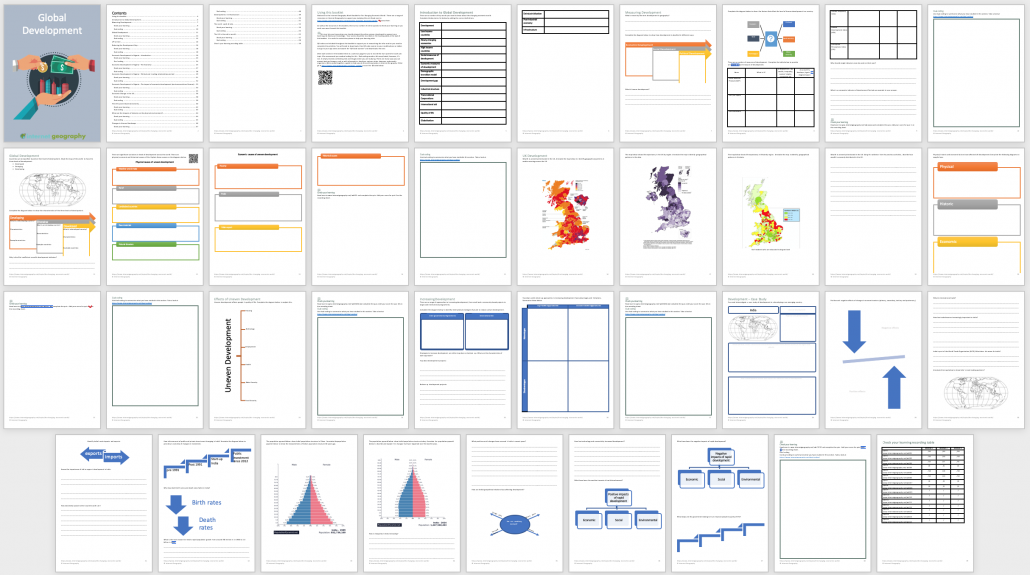
Global Development
Weather Hazards and Climate Change
Ecosystems, Biodiversity and Management (the deciduous forest)
Ecosystems, Biodiversity and Management (the UK and The tropical forest)
River landscapes and processes
Coastal landscapes and processes
Just a note of thanks for all of your hard work with this website. It is a fantastic set of resources and our students are benefiting greatly from them. I subscribed earlier this year and now the department has done which is good for us all. It is fantastic value for money and the materials have been welcomed by teachers, pupils and parents. It is good to know that it is a site you can trust to be AQA specific and kept so up to date.
https://www.internetgeography.net/wp-content/uploads/2019/09/The-Living-World-Ecosystems-and-Tropical-Rainforest-Work-Biiklet.png8921600Anthony Bennetthttps://www.internetgeography.net/wp-content/uploads/2024/01/Internet-Geography-Logo.pngAnthony Bennett2019-09-21 15:26:042019-11-10 16:36:00AQA GCSE Geography The Living World Work Booklet
https://www.internetgeography.net/wp-content/uploads/2019/09/South-America-1.png857569Anthony Bennetthttps://www.internetgeography.net/wp-content/uploads/2024/01/Internet-Geography-Logo.pngAnthony Bennett2019-09-16 19:25:102019-09-17 10:54:59Countries of South America Quiz
Recently, Nicole Craig (@NLCGeog) shared a resource on Twitter that has proven to be very popular!
I made this template well before summer (original idea wasn’t mine) and today was the first time I used it. This is ABSOLUTELY what I wanted it to look like 😍 Y10 definitely appreciated the different style of lesson #geographyteacherpic.twitter.com/dghXHONWZV
Nicole has kindly made the resource available to download on Internet Geography. Also attached to the resource is the information slide Nicole displays on the board for students and the information sheets they use to write their definitions in their own words.
Don’t forget to give Nicole a follow on Twitter. Please show your appreciation in the comments below or by contacting Nicole on Twitter She is keen to know if you use it for any other topics or have any suggestions for amendments or improvements.
Over the past few months, we’ve been developing a range of infographics covering common case studies in geography. The infographics provide a summary overview of the main features of each case study and are available as A3 PDFs and resizable .png graphics. The infographics can be printed for wall displays, collated into revision booklets and sent home with students to decorate their bedroom walls for revision.
Set 1
Set 2
Set 3
Set 4
Infographics often prove so effective in educational contexts because they use imagery to highlight, explain, or enhance text-based information. They have the unique ability to capture attention, convey information, and encourage data retention despite their complex nature.
Following a recent request from an Internet Geography Plus subscriber, we’ve just created an infographic covering Hurricane Matthew. We’ve made this available to download for free below.
Guest blogger Glynnis Morgan (@geographygem) discusses becoming a UN Climate Change Accredited Teacher.
If you are a Geography teacher on Twitter, you may have noticed over the summer holidays a spate of teachers proudly showing off certificates from various courses, and after several posts in this vain, a circular blue badge announcing themselves as a UN Climate Change Accredited Teacher.
First UN Climate Change Accredited Teacher Certificate
So what’s this all about?
The eduCCate Global Project has been organised by Harwood Education who have teamed up with the United Nations Institute for Training and Research (UNITAR) to “develop and deliver an innovative Climate Change Education Programme for primary and secondary schools in the UK” (Harwood Education 2019) Their mission is to ensure that there is a Climate Change Teacher, accredited by the UN Climate Change Learn Partnership, in every school around the world.
Once you have signed up to partake in the training, you need to work through 5 key courses and modules:
“Climate Change International Legal Regime”
“Human Health and Climate Change”
“Cities and Climate Change”
“Children and Climate Change “
“Open Online Course on Gender and Environment” (You only need to complete Module 1 from this course).
Each is a self-taught, self-paced course with a downloadable PowerPoint and PDF to accompany an interactive lesson. All you need to do is find a quiet place to sit down and work through them.
Being the Geography teacher stereotype I am, I armed myself with a pad of paper and my pencil case of coloured pens and highlighted and I took very colourful, highlighted notes. You don’t have to do this, but I found taking notes an easier way to take all the information need and gave me a point of reference for later use. I also set up a YouTube playlist to save all the fantastic videos in.
Once you have completed each course, advised to take around 2 hours, but I found it took longer as I made notes and viewed some of the extra supplementary material, you need to take the relevant quiz.
You get 3 attempts at the quiz, and you need to get 70% to pass. For the “Climate Change International Legal Regime” it works a little differently, there are 3 sections and each section has its own quiz, needing 60% to pass in 2 attempts. For each section, you receive a badge. Get all 3 badges, get the certificate for the module.
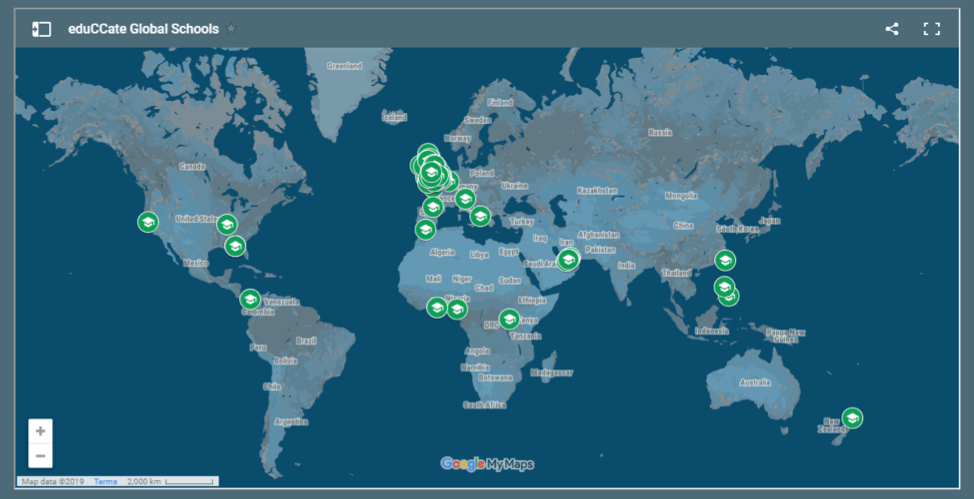
Once you have completed and passed the 5 required courses, you receive the final badge and become a UN Climate Change Accredited teacher. You then need to register this with eduCCate Global who will then add you to the world map of Climate Change Teachers.
UN Climate Change Accredited Teachers Map
But what’s the point in doing this?
Yes, it appeals to the competitive spirit in us, wanting to complete the courses and make an announcement that we too now have this accreditation. And of course, as professionals, we should be striving for further development of our subject knowledge for our own (and our students’) betterment.
But the main point of doing this is because climate change is the biggest social, economic, political and environmental concern of our time. Nothing else threatens our every day and our future as much as climate change and it impacts, and we need to be informed.
Back in March 2019, 4 students from a school in Oxford campaigned for better teaching on Climate Change. They launched a petition, which reached more than 50,000 signatures, stating that pupils need to be taught more about the impact of climate change. In response, the government said that the subject of climate change is already covered in science and geography (BBC 2019)
The Government’s response is correct. The Geography Curriculum refers to climate change, not only in its own individual topic of causes, impacts and responses but in many others as well, migration, energy security, food and water security, ecosystems, urbanisation and globalisation to name a few.
This qualification will add another string to many Geography teachers’ bows, and as the eduCCate Global website says, “transform knowledge into positive action”.
By providing relevant and up-to-date information on climate change, Geography teachers can make their lessons more informed than ever before. We can provide our students with the knowledge they need to help combat the impacts of climate change and lead a fundamental shift in the way we use and consume resources, travel, and treat the planet.
So if you are interested, you have until September 30th2019 to complete the courses before Phase 1 comes to an end.
Those of us signed up and accredited move into Phase 2 are excited and ready to take part!
Geography has been in the news all summer! Have you got what it takes to beat the Summer 2019 Geography in the News Quiz?
0%
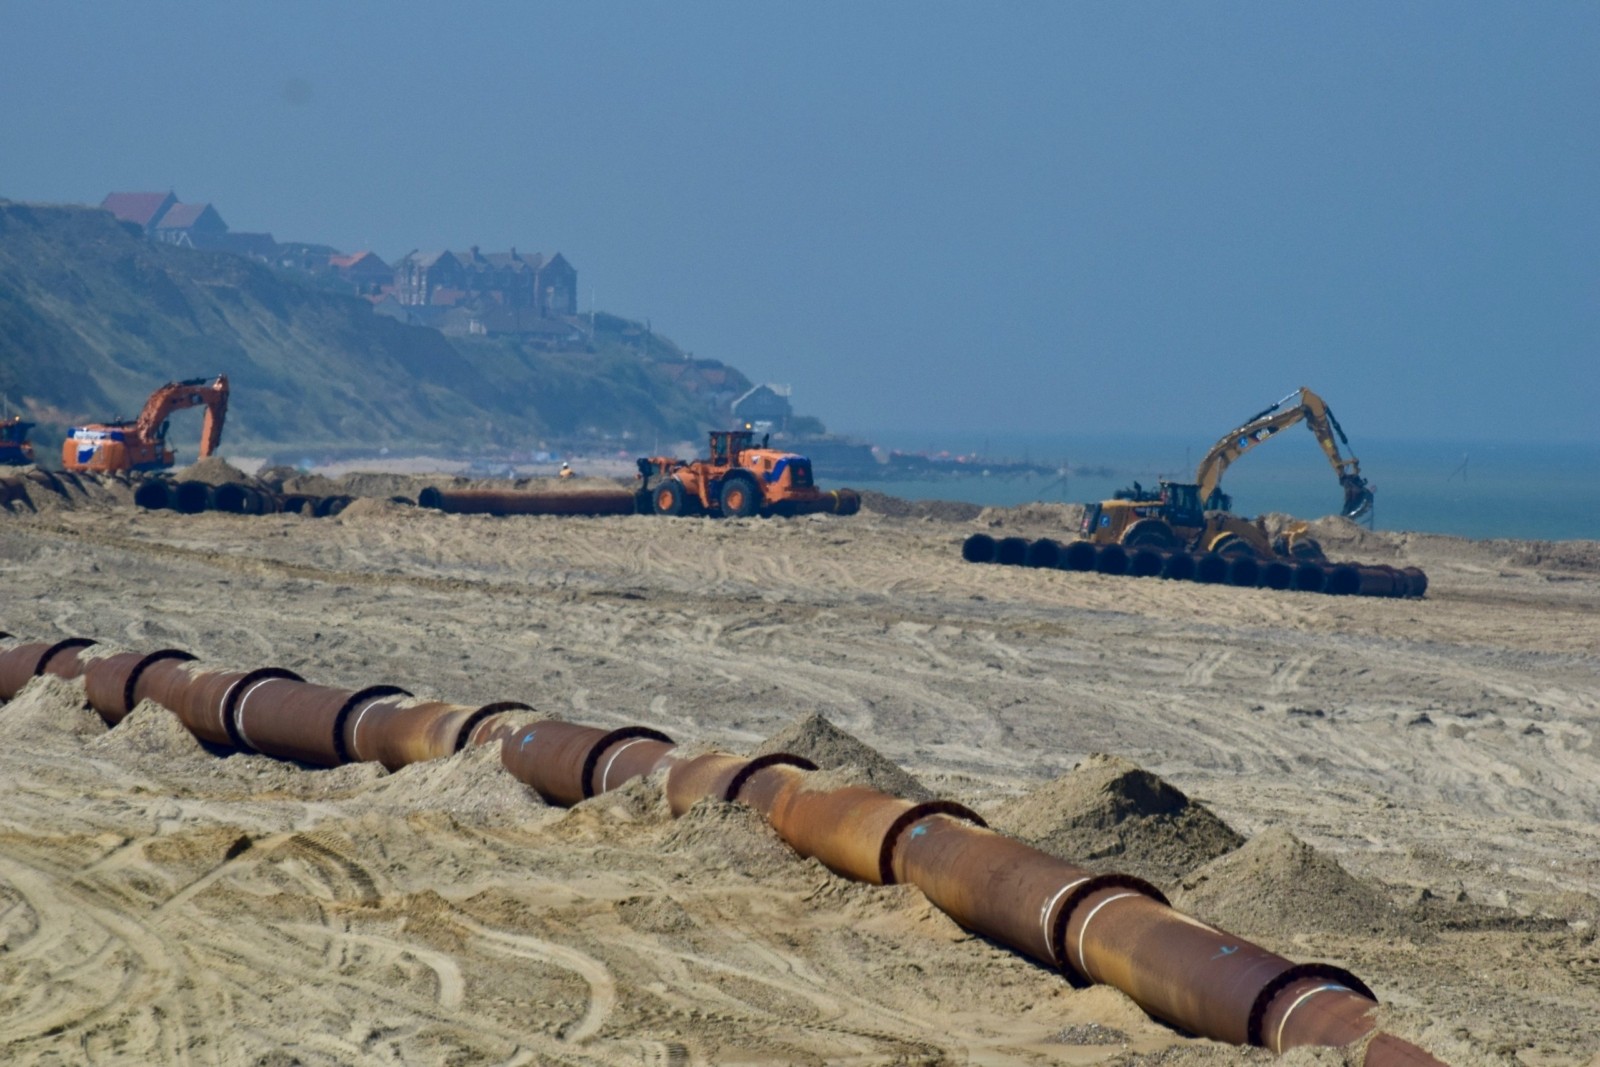
Over the summer sea defences have been constructed between Bacton and Walcott on the Norfolk Coast. What is the name of the technique being used?
Internet Geography
Correct!Wrong!
Sandscaping is the name of the processes which involves building up beach material by pumping sand onto the beach from off-shore sources.
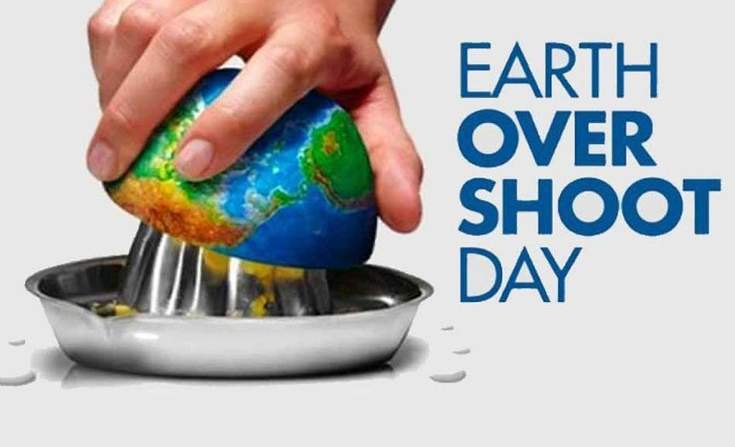
Earth Overshoot Day marks the date when humanity’s annual demand on nature exceeds what Earth’s ecosystems can regenerate in that year. What date was it this year?
Correct!Wrong!
Earth overshoot day was 29th July 2019. Over the past 20 years, it has moved up two months to July 29, the earliest ever.
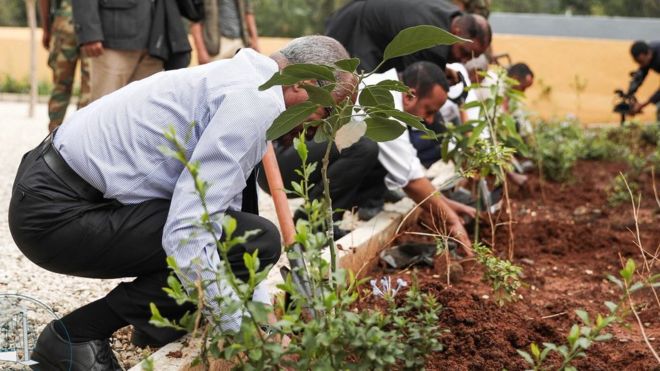
In July, which country broke a world record by planting 350 million trees in one day?
BBC
Correct!Wrong!
Ethiopia holds the record for planting the most trees in a day. Previously, the world Record for planting trees in a single day was held by India, which used 800,000 volunteers to plant more than 50 million trees in 2016.
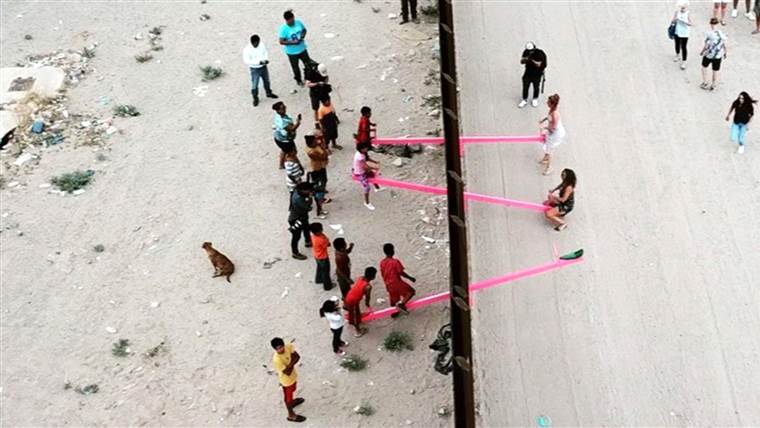
Across which border were a set of fluorescent pink seesaws built by a pair of professors seeking to bring a playful concept of unity to the two sides of the divide?
NBC News
Correct!Wrong!
Installed along the steel border fence on the outskirts of El Paso in Texas and Ciudad Juárez in Mexico, the seesaws are the invention of Ronald Rael, a professor of architecture at the University of California, Berkeley, and Virginia San Fratello, an associate professor of design at San José State University, who first came up with the concept 10 years ago.
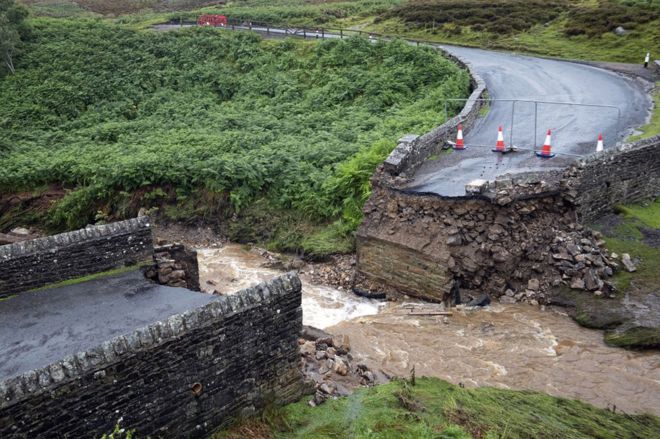
In July, flash flooding in Yorkshire led to the destruction of a bridge close to which settlement?
BBC
Correct!Wrong!
The bridge is located close to Grinton.
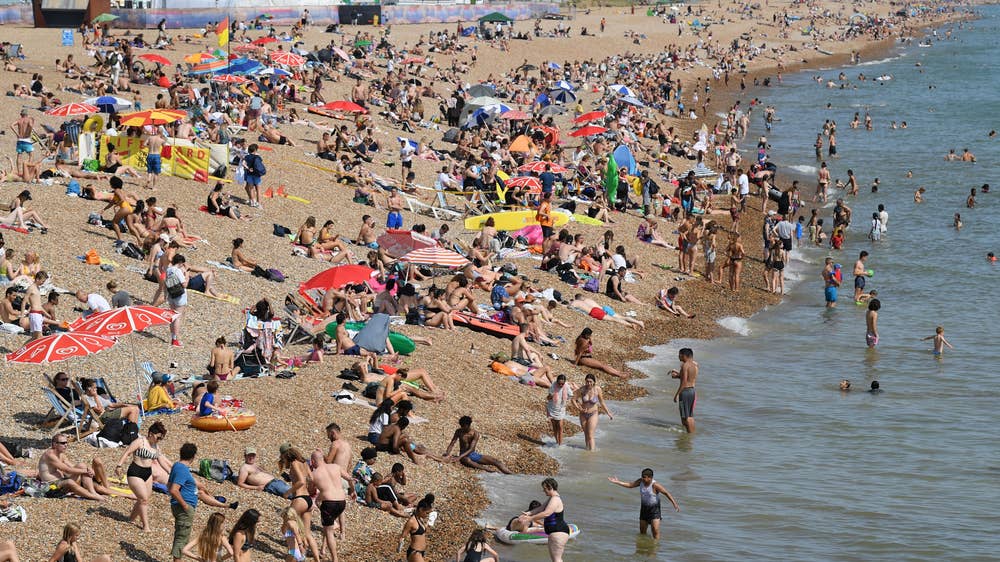
In July, the UK experienced its hottest day on record. What was the highest temperature recorded in the UK?
The Evening Standard
Correct!Wrong!
In July, the UK experienced its hottest day on record when temperatures reached a record-breaking 38.7°C at Cambridge University Botanic Gardens.
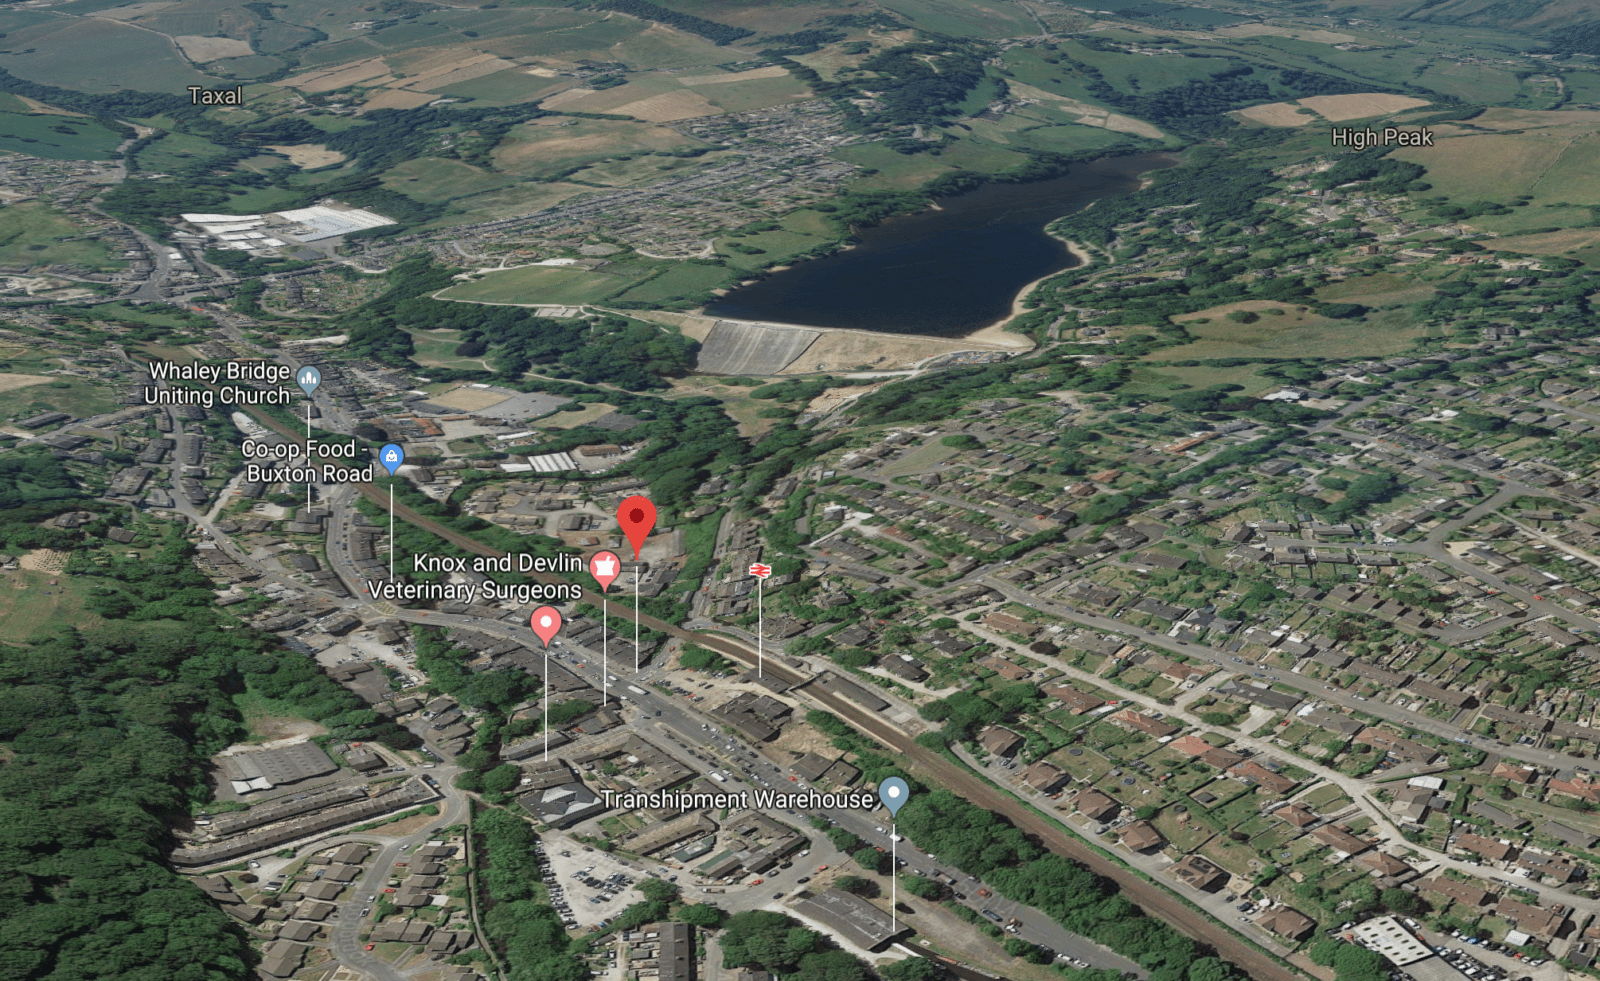
In the afternoon of Thursday 1st August the 1500 of the 6500 residents of Whaley Bridge, Derbyshire were evacuated due to the increased risk of the dam wall at which reservoir collapsing?
Google Earth
Correct!Wrong!
The Toddbrook reservoir had to be reinforced to reduce the risk of collapse. This was don by the RAF dropping bags of ballast onto the damaged dam.
Name the typhoon that killed 44 people in eastern China after landslide and floods in August.
The Guardian
Correct!Wrong!
The typhoon that affected China in August was Lekima.
In August it was announced drugs show ‘90% survival rate’ in a breakthrough trial for which virus?
Medical Xpress
Correct!Wrong!
Ebola may soon be a "preventable and treatable" disease after a trial of two drugs showed significantly improved survival rates, scientists have said. Four drugs were trialled on patients in the Democratic Republic of Congo, where there is a major outbreak of the virus. More than 90% of infected people can survive if treated early with the most effective drugs, the research showed.
Where did rare lightening strikes occur on 10th August 2019?
National Geographic
Correct!Wrong!
The North Pole lightning was detected by The National Weather Service of Fairbanks, a mere 300 miles from the North Pole between 4 pm and 6 pm on August 10.
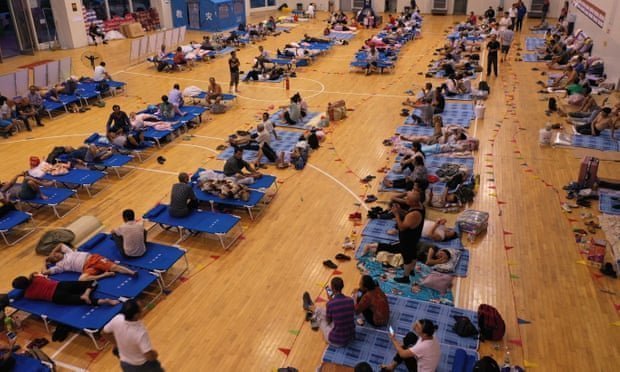
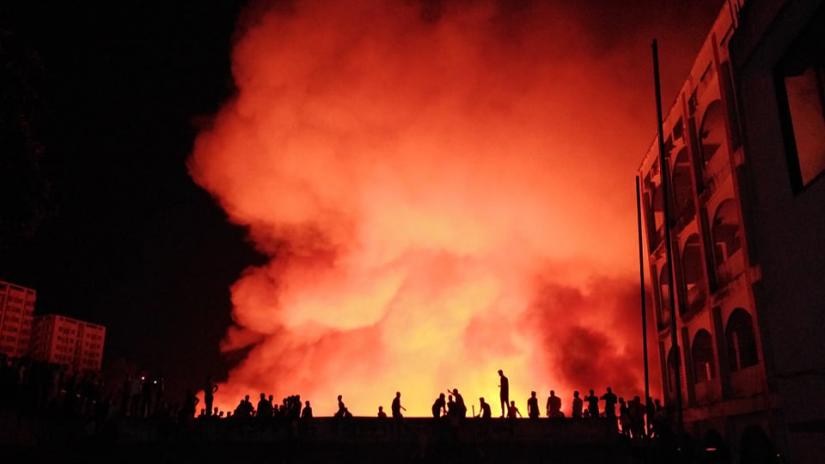
In which city did a devastating slum fire destroy homes of more than 10,000 people?
Correct!Wrong!
A devastating slum fire in Dhaka, Bangladesh, destroyed homes of more than 10,000 people. The majority of the slum's residents are low-paid workers from nearby garment factories.
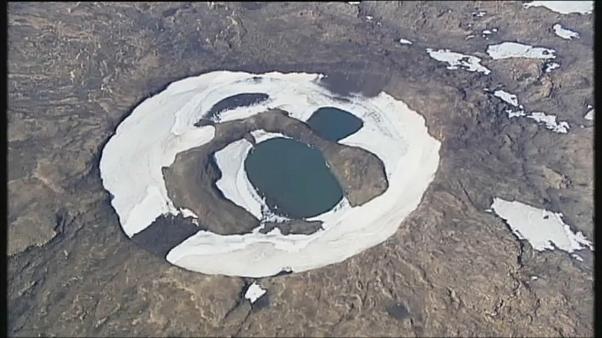
Which country mourned the death of a glacier in August 2019?
Euro News
Correct!Wrong!
Ok Glacier is the first in Iceland to be formally declared dead ice.
President Trump announced he wanted to buy Greenland in August 2019. Greenland is an autonomous territory within the Kingdom of which country?
Correct!Wrong!
Greenland is an autonomous territory within the Kingdom of Greenland.
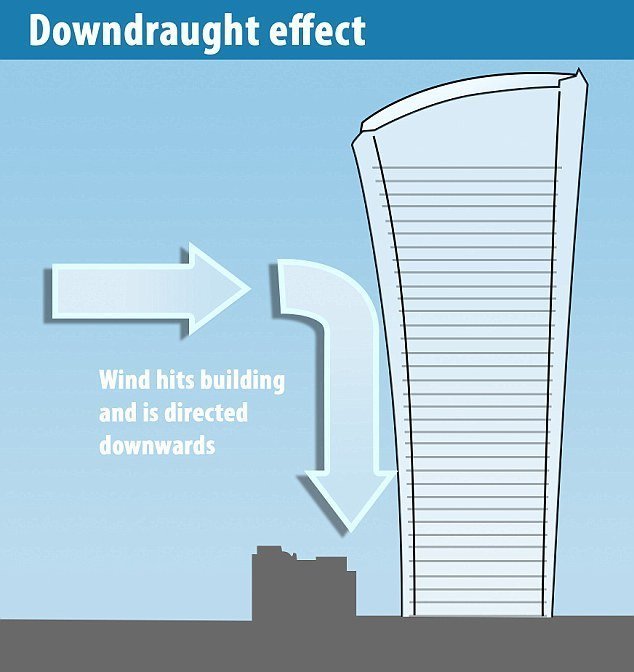
In August which city tightened rules on skyscrapers over wind tunnel fears?
Daily Mail
Correct!Wrong!
Tougher building rules for skyscrapers have been drawn up by the City of London because of concerns that a high-rise, urban microclimate will generate winds capable of knocking over cyclists and pedestrians.
Who sailed the Atlantic Ocean to participate in UN climate summits in New York City and Chile?
Correct!Wrong!
Greta Thunberg sailed across the Atlantic.
President Trump was also in the news in August suggesting nuclear weapons should be used to combat which natural hazard?
Getty Images
Correct!Wrong!
Using nuclear weapons to destroy hurricanes is not a good idea according to the US scientific agency. You know this, I know this, he doesn't know this.
Which disease did the UK lose its eradicated status by the World Health Organisation in August 2019?
NHS Direct
Correct!Wrong!
Measles has returned to four European nations previously seen as free of the illness, according to the World Health Organization (WHO). The disease is no longer considered eradicated in Albania, the Czech Republic, Greece and the UK.
Identify two ecosystems affected by wild-fires during August 2019.
ABC News
Correct!Wrong!
Wildfires affected both tropical rainforests and tundra during August 2019.
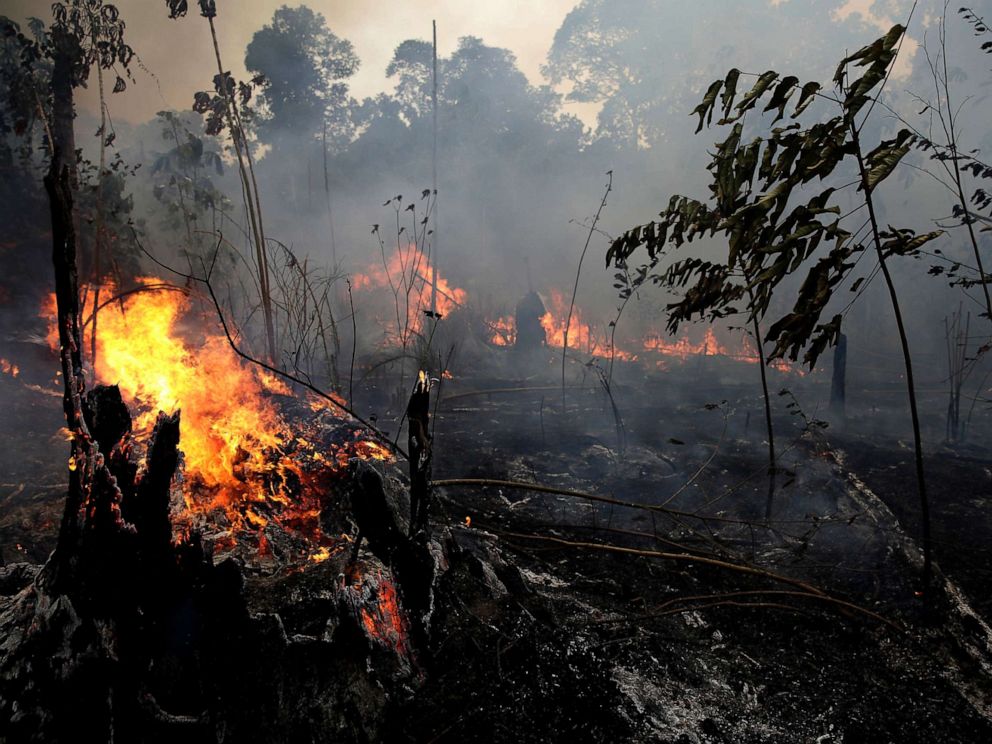
Which celebrity and environmental campaigner announced a $5 million pledge to help reduce the number of fires in the Amazon rainforest?
Correct!Wrong!
Hollywood star Leonardo DiCaprio has announced a $5 million pledge to help reduce the number of fires in the Amazon rainforest. It comes amid a global outcry over fires in the Brazilian Amazon, with celebrities calling for action and pledging to donate to efforts in order to tackle the issue.
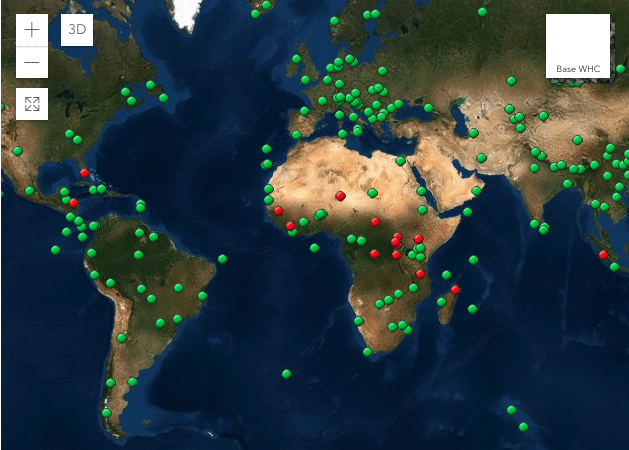
The outlook for which World Heritage site was officially downgraded from poor to very poor due to climate change?
UNESCO
Correct!Wrong!
The Great Barrier Reef's outlook has been officially downgraded from poor to very poor due to climate change.
Rising sea temperatures thanks to human-driven global warming remain the biggest threat to the reef, a five-year Australian government report says.
Geography in the News Summer 2019
Oh dear. You're Donald Trump.
Hi Donald, thanks for having a go at the summer 2019 geography quiz. Don't go nuking any hurricanes now.
You're an advisor to Donald Trump?
Oh dear, you're probably qualified to advise Donald Trump. You could do with reading the news a bit more often.
You're no Donald Trump!
Not bad. You're probably smarter than Donald Trump. Keep reading and watching the news.
Geography legend!
Well done. You know your geography in the news. You're smart and know what's going on around the world. You are or should be a geography teacher. Get some leather elbow patches like those above.
Share your Results:
If you are looking for strategies to encourage your students to pay more attention to geography in the news, take a look at our free homework template to support them structure their research.
Guest blogger Alison Schofield (@alisongeog) discusses how using narratives in geography lessons has supported GCSE improvements.
I have been teaching geography now for over 20 years and I love the geography community that exists in social media who are always sharing their ideas and resources so I thought I would share how I have used narratives in my teaching at GCSE as one technique.
All my GCSE groups are taught in mixed ability with target ranges from 1-9 which does hold challenges when trying to incorporate knowledge and understanding of the places and concepts we teach. It became apparent to me that the way my department and I were teaching was not working for all and I had to go back to the drawing board.
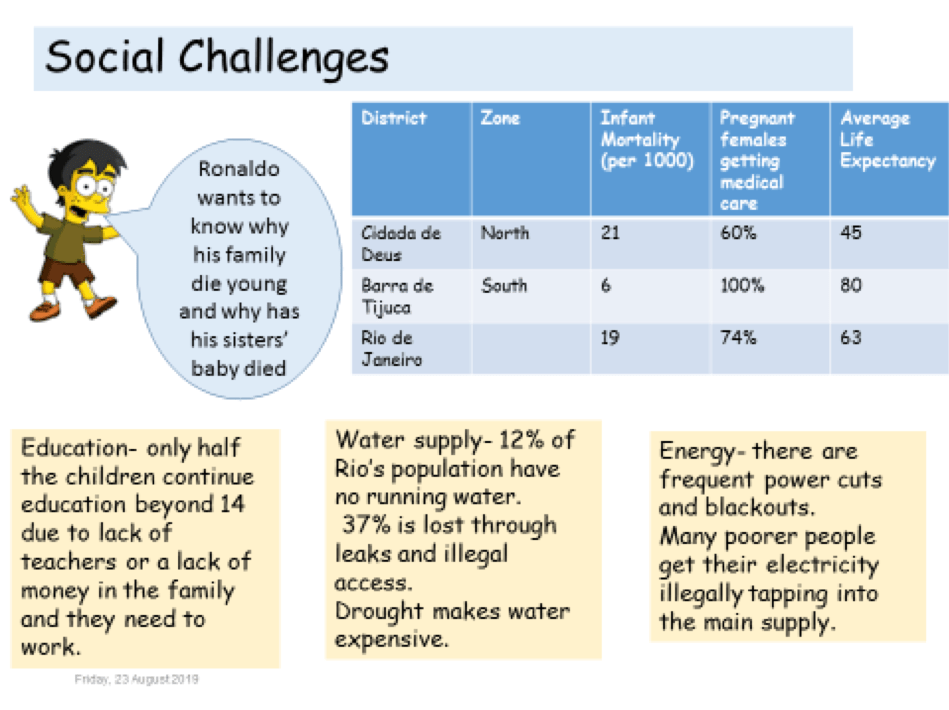
I decided that I would focus on one topic and create a story about a boy who lives in the Favelas in Rio. I used a Simpson’s character who lives in Brazil and used him to tell the story of his life and those around him. We investigated why he lived there, what his life was like and why. Below is one of the slides I used.
Narratives in geography – example 1
By using him to tell a story every single lesson the knowledge and understanding started to stick. Answers were given verbally and in written format actually stared to reference the case study. Students who struggled to get 1 mark in a 9 mark question retold the story enabling higher achievements. More importantly, it made the teaching and learning fun again, something that had been somewhat missing after the new specification changes.
Below is another example I have used.
Narratives in geography – example 2
I am happy to say that making little changes like these have meant that my department has seen an increase of nearly 20% in attainment from last year’s GCSE results, so I will continue with my storytelling.
Internet Geography is offering a platform for guest bloggers for this academic year. Got a teaching strategy, interest or anything geographical you’d like to share? Please contact us. We’re unable to offer a financial award but we’ll send you a little treat in the post.
Students should be encouraged to revise from the beginning of their geography course. By getting into good study habits early on and re-visiting content regularly, they are more likely to achieve success in their final exams. However, setting revision and homework throughout the year can be a laborious task, let alone tracking what has been set. Therefore, we’ve developed a tool to generate monthly revision plans, that track the content and skills being covered, to ensure the full specifications of AQA GCSE Geography and iGCSE Geography is covered.
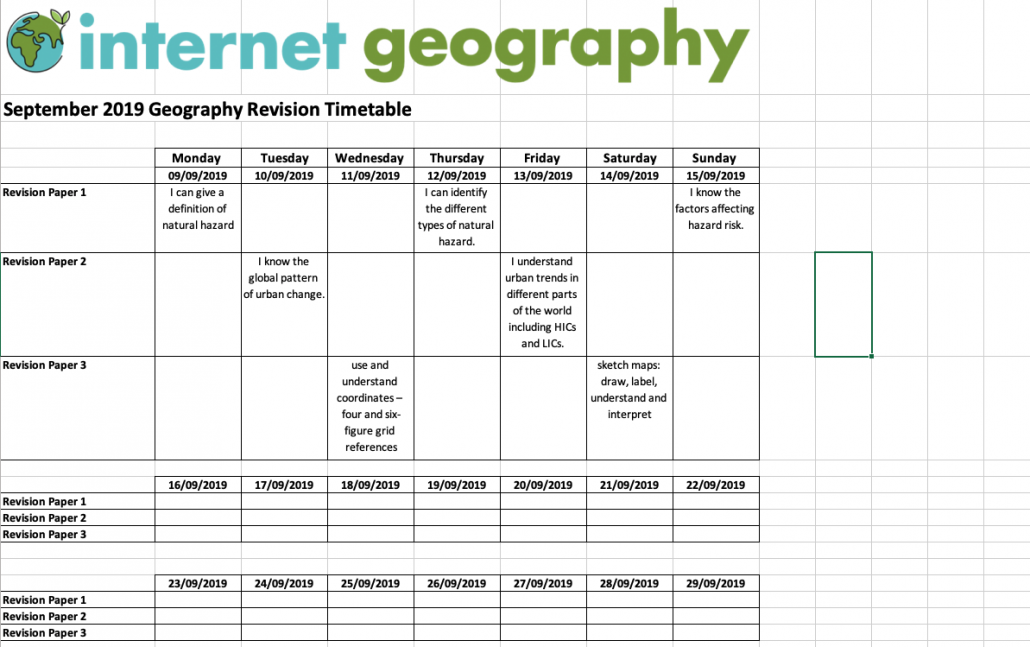
Through selecting the content students should revise, using drop-down menus a monthly overview plan is generated, ready for printing or exporting to PDF for your VLE. The screenshot below shows a drop-down menu containing I can/know statements, which when clicked, display in the cell. The bank of statements are fully customisable to cover your case studies etc.
Geography revision plan generator and tracker
Once you have selected the areas students should revise the statements are displayed as below.
Example of a week’s revision
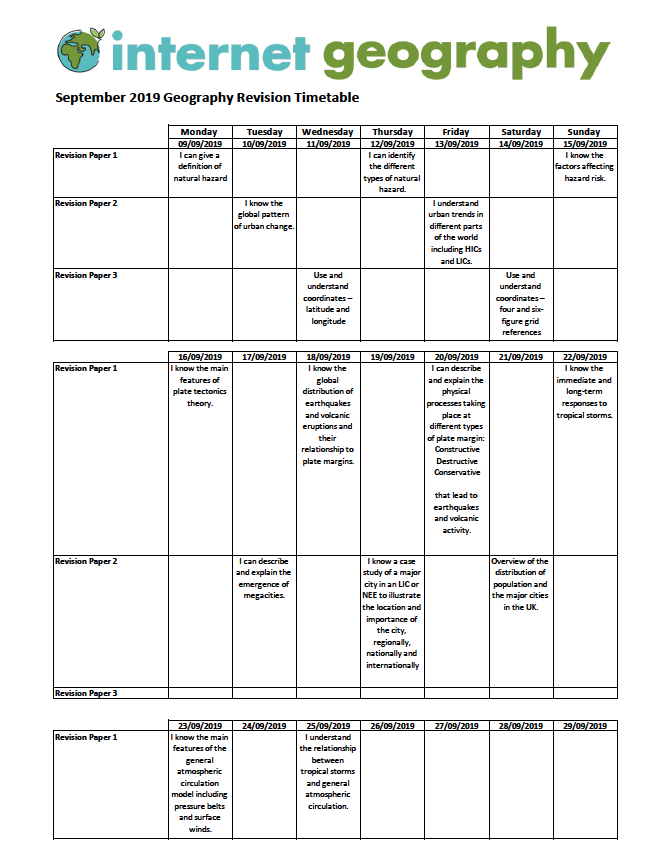
The image below shows an example of a completed revision timetable.
Example revision timetable
In a separate sheet in the tracker, the revision you have set is automatically recorded providing you with the big picture of what has been covered.
Revision tracker
Having put this together it is clear that students need to start getting into good revision habits or retrieving information a lot earlier in the course. With over 200 areas of the specification to cover, last minute revision is clearly not enough.
The fully customisable Geography Revision Generator and Tracker for AQA and iGCSE GCSE Geogrpahy is currently in development but V1.0 is available for free to subscribers to Internet Geography Plus in the member’s area. Not a member? Take out a low-cost subscription.
https://www.internetgeography.net/wp-content/uploads/2019/08/Geography-Revision-Generator-and-Tracker-1.png6701200Anthony Bennetthttps://www.internetgeography.net/wp-content/uploads/2024/01/Internet-Geography-Logo.pngAnthony Bennett2019-08-28 10:53:152019-09-09 21:18:41Geography Revision Plan Generator and Tracker
We’re really pleased that guest blogger, Abdurrahman Pérez (@mr_perez5), is back discussing his strategies for encouraging students to develop their answers to geographical questions further.
My biggest takeaway having finished my second year in the classroom was how often I was finding students were leaving arguments/points half-done, undeveloped and leaving me asking “so?”, “and?” or “why?”. I was writing these three questions on student work so often I thought I had to do something about it. So much was it a worry for me that when I finally put up the display on it (which I’ll get back to later), I began every lesson introducing it, telling all my classes where the display was, why I had made it and how they could use it. My thoughts on being honest with pupils are perhaps for another time, but I cannot overstate its importance – why let them be mind-readers? Tell them what you want from, why you do what you, why you’re approaching a lesson a certain way, etc… Anyway, that’s for another time!
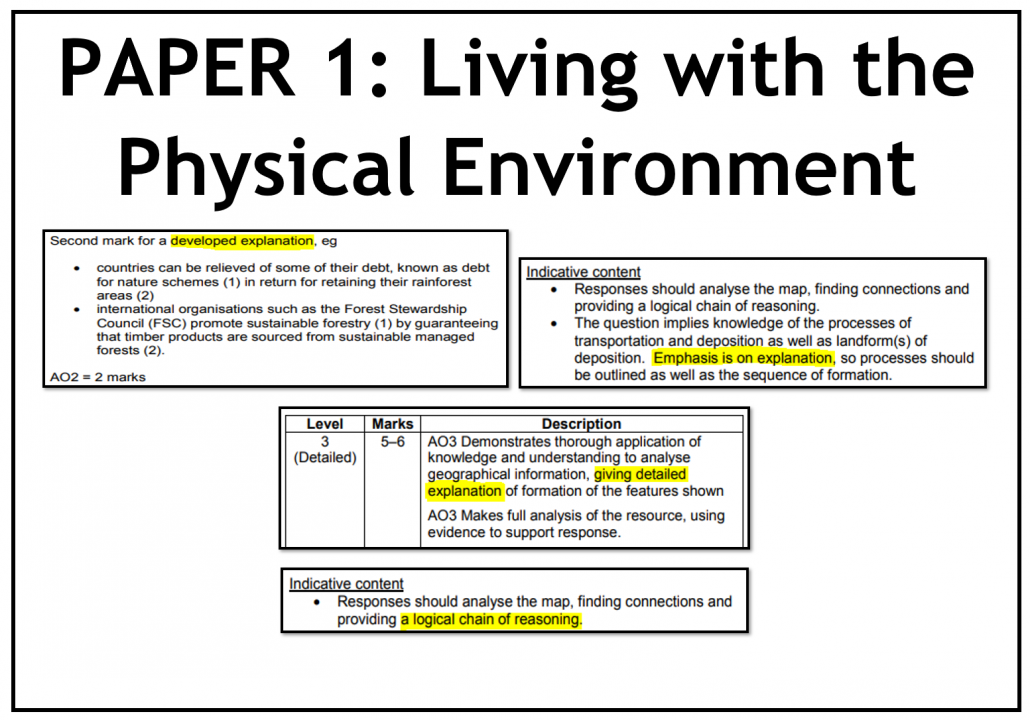
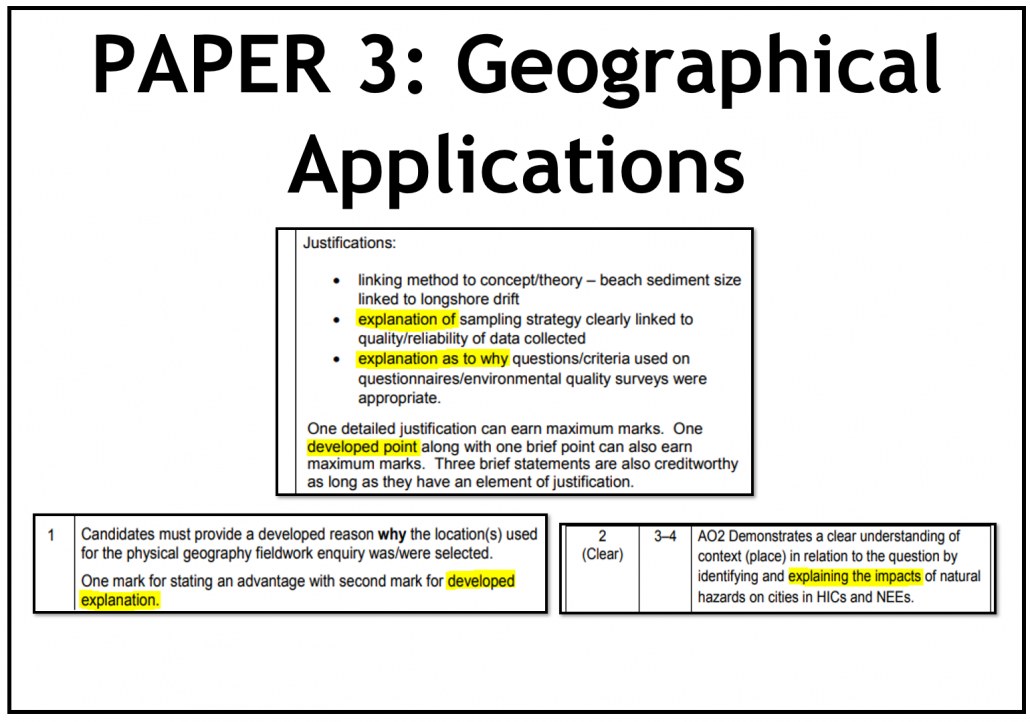
The AQA mark schemes want “developed” responses, so does Edexcel (as well as “logical connections”) and Eduqas call them “chains of reasoning”, a much better way of thinking about it, but my thoughts on why Eduqas is infinitely better than AQA and all the rest deserve a whole book, so I’ll leave it there!). Below you can see some AQA examples, which I decided to keep out of the final display as they are unnecessary and made it far less student-friendly. The urge to address this was further compounded when I recalled some of my Year 11s scripts from the summer exams and noticed how ‘highly-rated’ the approach of elaborating and explaining themselves my pupils had used to good effect was. (This would later be confirmed when I did some exam marking over the summer and noticed how successful candidates who properly developed their answers were.
Paper 1 Living with the physical environment
Paper 3 Geographical Applications
In my department, we start everything from KS3, not in the exam-factory sense, but more in a bid to get the right skills embedded by the time students get to Year 10 when we start our two-year GCSE. This means I wanted everyone to be elaborating and developing their points, from 7 set 5 to my Year 13s. In my opinion, this approach is totally applicable to all ages and abilities – in fact, my explanation of the display was no different with 17-year-olds than it was with 12-year-olds…
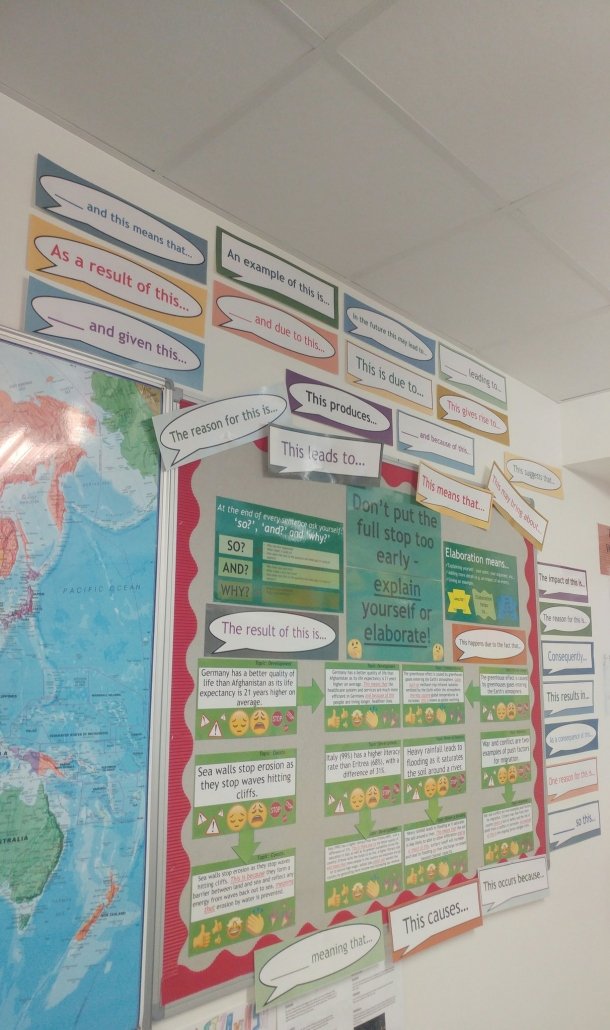
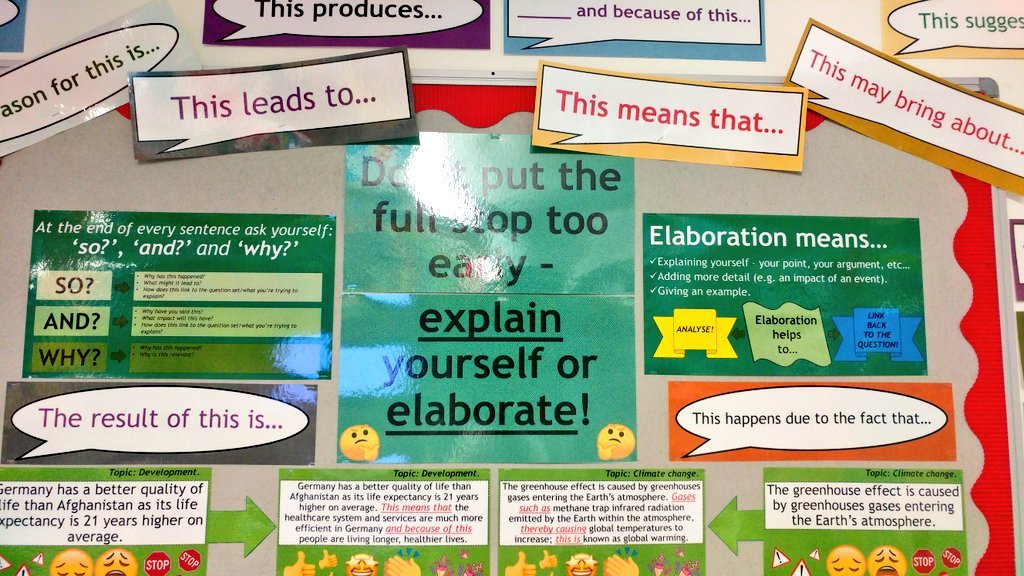
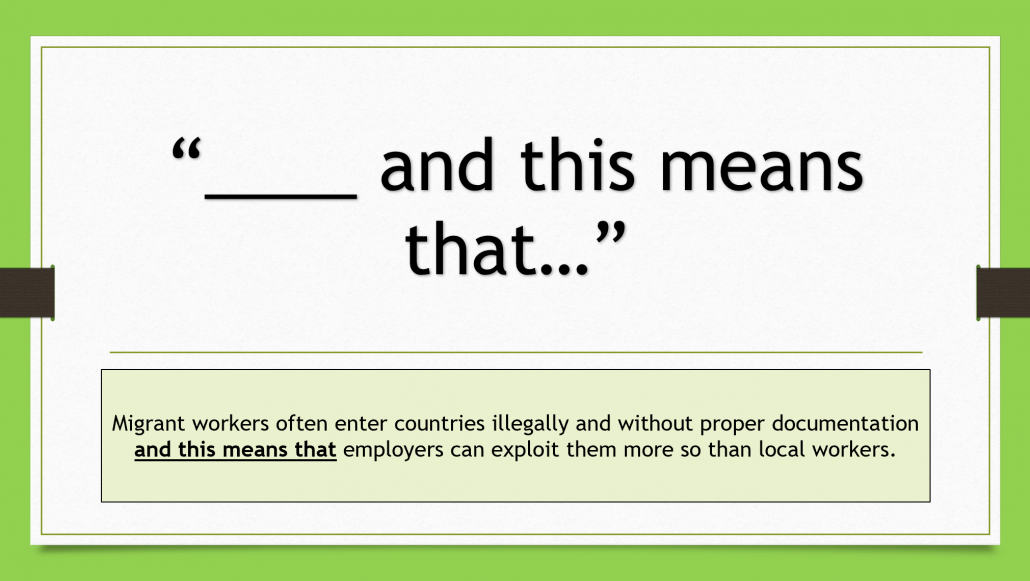
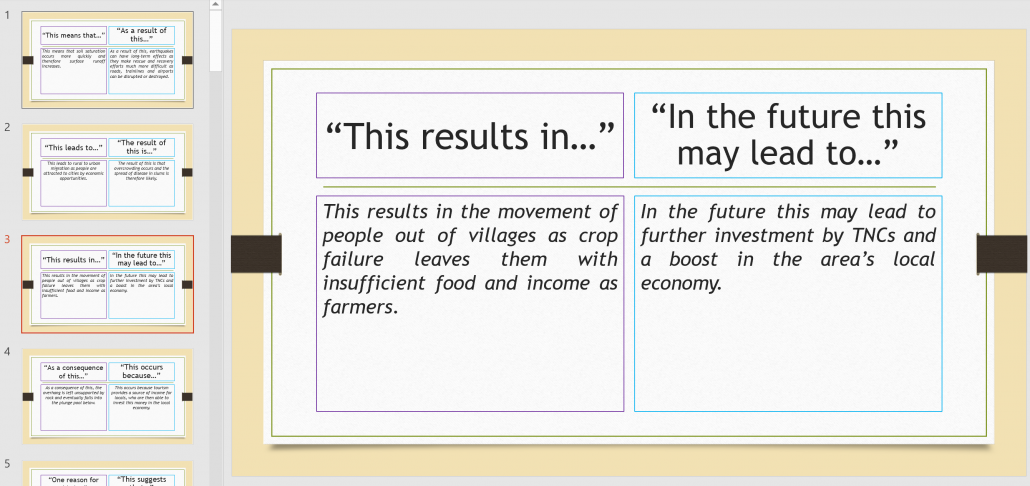
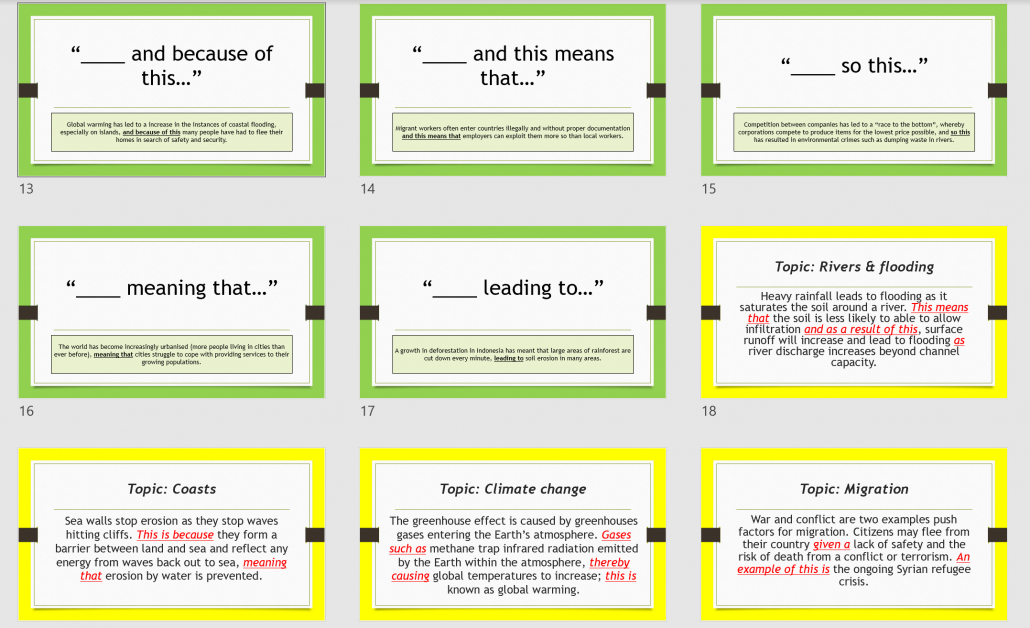
I call it “don’t put them full stop too early” – I want my pupils to elaborate on their evidence, explain their arguments or develop their points. This concept is at the heart of acronyms such as PEEL, PEDaL, etc, so chances are you are aiming for it too. I don’t want: “heavy rainfall leads to flooding as it saturates the soil around a river” – I want “heavy rainfall leads to flooding as it saturates the soil around a river. This means that the soil is less likely to able to allow infiltration and as a result of this, surface runoff will increase and lead to flooding as river discharge increases beyond channel capacity.” Yes, the sentence is longer but now I know that the pupil knows their stuff and I expect this from Year 7s, mind. I tell my pupils that I know and trust they know their stuff (most of them at least!), they just need to prove it because I won’t assume anything when I’m marking their work or questioning them in class; for the older ones, I tell them to prove it to an examiner who has never met them. To help them do this, my pupils are presented with a number of stems.
Wall display to support elaboration
Explain yourself or elaborate
Writing cues
The display:
I am not interested in wading into the whole “what is the point of displays?” ‘debate’ that has cropped up on Twitter an annoying amount of times. Am I covering exactly 44.56% of my walls? I don’t know. Am I complying with fire-safety rules? I’m not sure…(?). Am I distracting pupils? I sure hope not…
What matters is that this display works with for me and I use it very often for the benefit of my pupils. That is all that does and will ever matter in the display debate. I am often directing students to its use and I encourage students to look at it whilst completing in-class extended writing (we call them Big Writes) and I even get them to use them whilst stretching their verbal responses to my question. For example, if a pupil has given me an answer and I want more from them, I will challenge them to turn around and use one of the stems to extend their answer. Or I might get another pupil to do this for them.
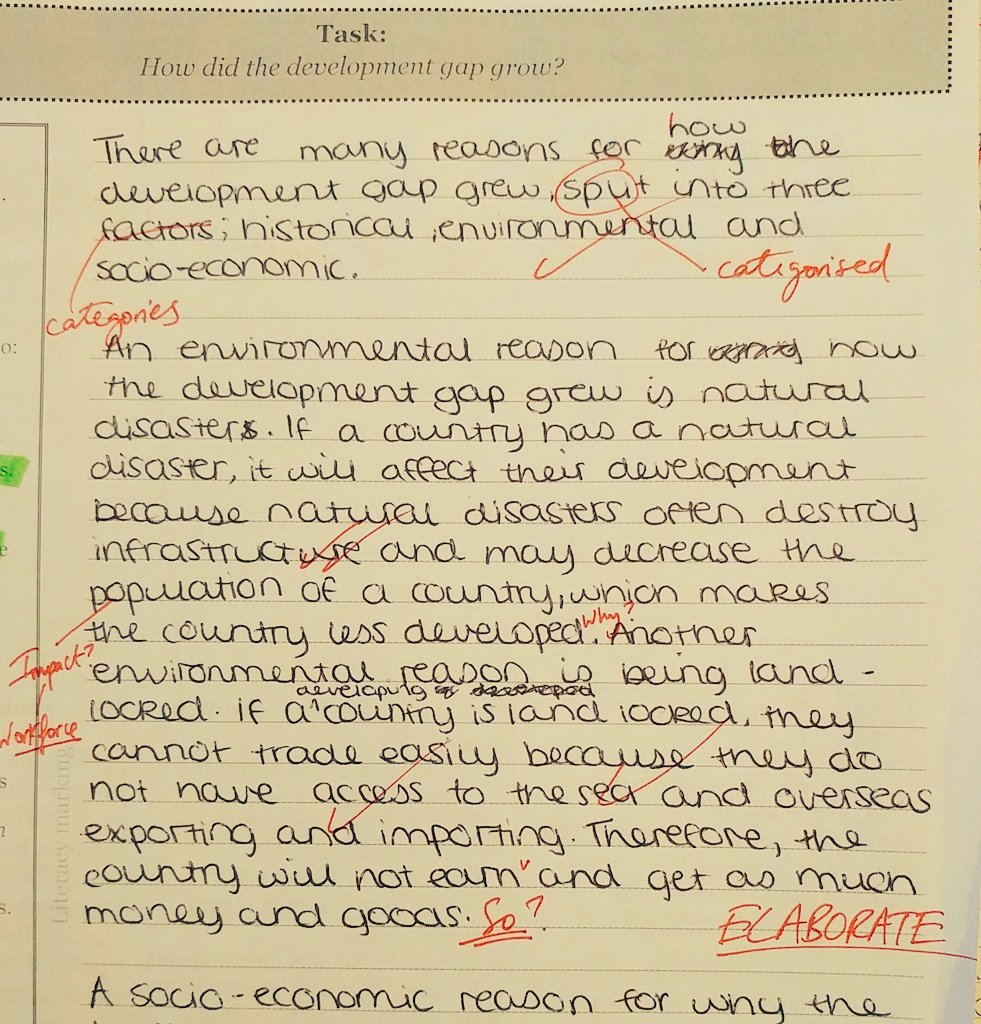
This led to some good results here and there – this year 9 pupil you can see is in the process of grasping it:
Example of response
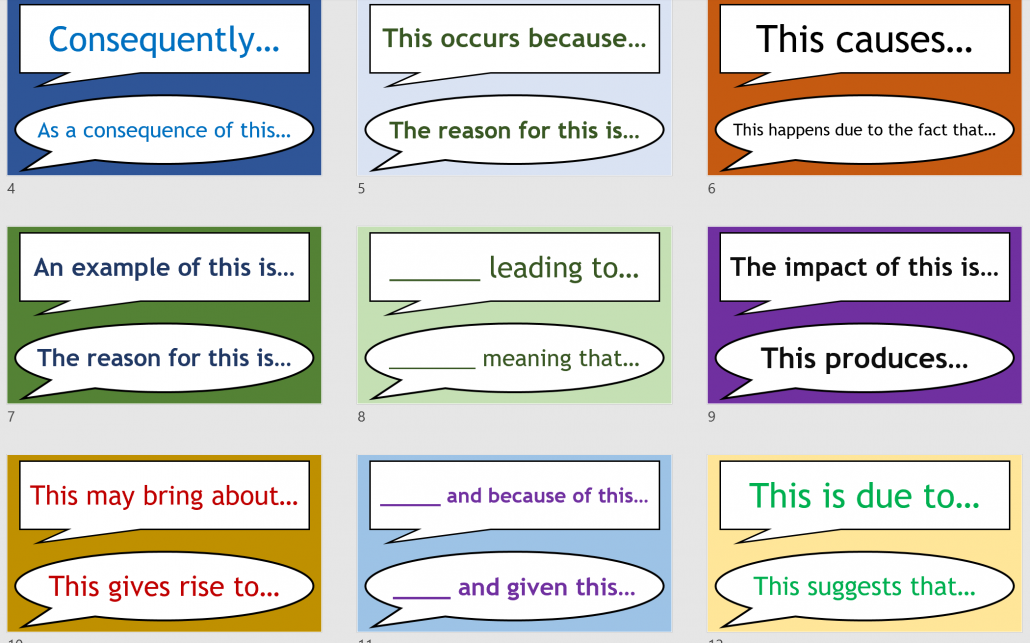
However, this is still a developing approach and is by no means embedded. I need to model it for pupils more often and maybe even the fact that the display is at the back of my class makes its use impractical. This is partly the reason why I have created laminated cards. Inspired by @missgeog92, these will be placed into the boxes I have on my desks which currently house the glues, scissors and dictionary, held together using some cheap binding rings from Amazon.
And this means that…
This results in
Writing cues and examples
What matters really is how much I push them. I, and you if you decide to use them, cannot just hope pupils will diligently pick them up during a lesson and just use them. After all, how many of them use those nice laminated matts you put out every so often? Pupils need training and modelling, so that’s my task in September. Hopefully, if I do it often enough it’ll stick! It’s easy to want rapid results but you and I know that’s not how teaching works – it’s not how children (and their brains) work! To ‘convince’ them I have often used lots of written and verbal examples, I praise its use pupils and I often refer to the actual display in lessons, getting the whole class to turn and face it – much to the chagrin of moody teenagers! However, what I think really struck a chord with some – and to return to my point of being honest with students – is when I explained why they should use the display.
I told/tell them elaboration can mean: (1) explaining yourself – your point or your argument; (2) adding more detail (e.g. an impact of an event) or (3) giving an example. I tell them it can help to analyse (the A-Level lot love this) or a way to link back to the question (and the GCSE classes lap this up!). I ask them to ask themselves the very same questions I am left asking when I’ve read their work: So? And? Why? That’s when a lot of them ‘get it’.
I think we’re all trying to do this in some sort way – in fact, I initially thought this might be a good blog post because I saw @Geoisamazing’s brilliant “This means that…” resource recently on Twitter and it reminded me of what I had done/was planning to do. It is definitely a case of ‘slowly, slowly catchy monkey’ (very slowly with some pupils or classes), but it’s certainly worth sticking with. You’ll notice differences in oral responses as well written answers in time and that will mean you will have equipped your pupils with the tools to produce work you – but more importantly, they – can be very proud of!
Internet Geography is offering a platform for guest bloggers for this academic year. Got a teaching strategy, interest or anything geographical you’d like to share? Please contact us. We’re unable to offer a financial award but we’ll send you a little treat in the post.