Extreme weather in the UK – 2019

Extreme weather in the UK – 2019

From heatwaves to flash floods, the UK has experienced several extreme weather events this year. Extreme weather is when a weather event is significantly different from the average or usual weather pattern and may occur over one day or a period of time. Flash flooding, drought, storms, cold spells and heatwaves are all examples of extreme weather in the UK.

The UK experienced two extreme weather events within a fortnight in July 2019. Below we explore their causes, impacts and the relationship between extreme weather events and climate change.

July 2019 Heatwave

In July, the UK experienced its hottest day on record when temperatures reached a record-breaking 38.7°C at Cambridge University Botanic Gardens. An extreme pattern in the jet stream caused the heatwave. The jet stream separates hot air in the south and cold air in the north. An extreme kink in the jet stream, caused by an omega block (a high-pressure pattern that blocks and diverts the jet stream) allowed a mass of hot air to flow up from northern Africa and the Iberian peninsula – following a similar extreme weather event last month that made it the hottest June on record.

The heatwave had a significant impact on the UK transport infrastructure.

Rail transport experienced disruptions due to the risk of railway lines buckling, damaged overhead electric wires and high temperatures on trains. The train company LNER allowed customers with tickets for the 25th July to travel on Friday 26 July, Saturday 27 July and Sunday 28 July.

High temperatures, up to 39.4°C, were recorded on the tube in London.

Manchester Metrolink put in place temporary speed restrictions across its network as speed limits on most commuters lines were cut from 60mph to 30mph.

Lidos in Peterborough, London’s Tooting Bec and at Hemsley in York had to turn away prospective swimmers after reaching capacity.

In Bristol, a major water main burst due to hot temperatures making the ground shift leading to pipes contracting and expanding, left thousands of people without water. Vulnerable people had bottled water delivered to them, and tankers provided water in the area.

According to the comparison website, Price Spy, some retailers increased the price of fans and portable air conditioners by up to 40% within a month.

Animals also suffered during the heatwave. SEA LIFE Blackpool cooled the seawater for the first time in 30 years

The heat led to the cancellation of five of the six greyhound races due to take place on Thursday 25th July.

Police in Devon issued a warning to the public not to leave pets inside cars after officers rescued a dog locked inside a vehicle for more than three hours.

The hot daytime temperatures led to evening thunderstorms across the country.

It was not just the UK that experienced high temperatures. Many countries across Europe also experienced record-breaking temperatures including Germany, The Netherlands and France.

In the Netherlands, the national institute for public health and the environment issued a “smog alarm” due to severe air pollution in parts of the country due to ozone in the air.

July/August 2019 Flash-flooding

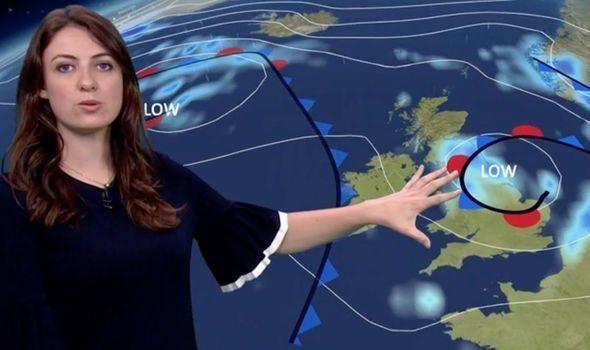
July also saw intense rainfall across parts of the country including central areas, the north-east and north-west of England. Several low-pressure systems affecting the UK caused the rainfall.

Low-pressure systems affecting the UK 29-07-19 – Source BBC

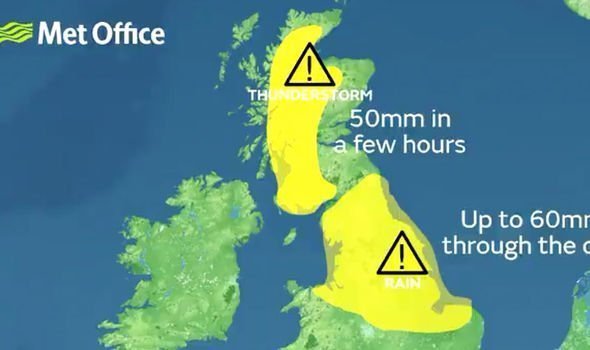
Met Office issues two weather warnings for Wednesday (Image: MET OFFICE)

The conditions were a long way from the previous week’s record highs as blistering sun basked Britain.

The Environmental Agency issued multiple flood warnings and alerts covering central, north-west and north-east England following heavy rainfall from the 28th July 2019.

An Environment Agency incident room for the north-west was set up in Warrington on 28th July.

Heavy rainfall caused widespread flooding in North Yorkshire on the 29th of July. The fire service received 115 calls concerning flooding incidents in Leyburn and Reeth on Tuesday evening. Photographs and videos from the nearby village of Grinton showed a bridge, used in the 2014 Tour de France, in ruins.

Commuters faced chaos Wednesday morning as heavy rain flooded the railway between Manchester Piccadilly and Crewe/Stoke-on-Trent, causing both lines to be blocked.

Northern Rail suspended trains between Ribblehead and Kirkby Stephen after a landslip between Dent and Ribblehead.

A major incident was declared late on Wednesday 31st July in Poynton, Cheshire, where thunderstorms and flooding forced drivers to abandon their vehicles and caused damage to property.

The wet weather also disrupted the railway line between Manchester airport and Wilmslow early on Thursday 1st August.

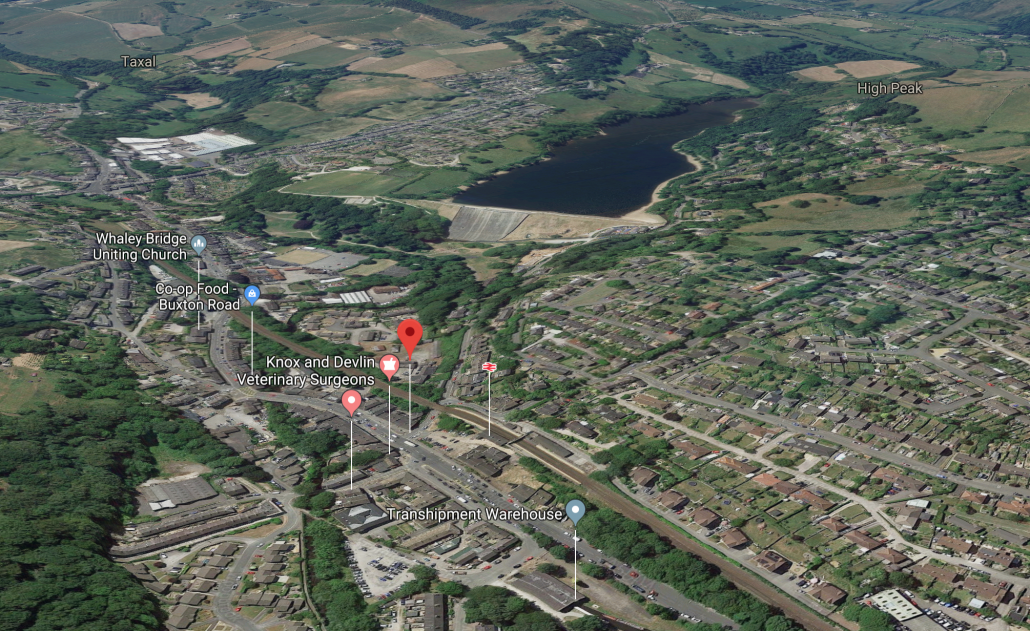
In the afternoon of Thursday 1st August the 1500 of the 6500 residents of Whaley Bridge, Derbyshire were evacuated due to the increased risk of the dam wall at Toddbrook reservoir collapsing.

Whaley Bridge

Residents of Whaley Bridge in Derbyshire were asked to leave their homes due to a severe flood warning indicating danger to life. Police told residents to gather at a local school, taking pets and medication with them.

Evacuated residents were told to arrange accommodation due to limited space, but some local pubs and community halls offered to take in evacuees.

Pictures on social media showed panels on one side of the dam had collapsed.

Significant overflow from the reservoir, caused by heavy rain, undermined the reservoir presenting a risk of collapse. The Canal and River Trust drained the water from the reservoir in a bid to reduce the pressure on the dam wall. The fire brigade also used ten high-volume pumps, with the capacity to move 7000 litres of water per minute,  to remove water from the reservoir.

Offers of shelter for people displaced by the flooding in Whaley Bridge were made on social media.

The local secondary school was used as a command centre for emergency services.

An RAF Chinook helicopter has been used to drop ballast to divertwater courses flowing into the reservoir and shore up the dam itself.

Elsewhere in Derbyshire, the A6 between Buxton and Bakewell was closed, and ten cars in the Scropton were recovered from floodwaters.

In Leicestershire, an international Scout and Guide camping event at a farm near Ibstock ended early due to the “unprecedented” wet conditions.

Is our extreme weather linked to climate change?

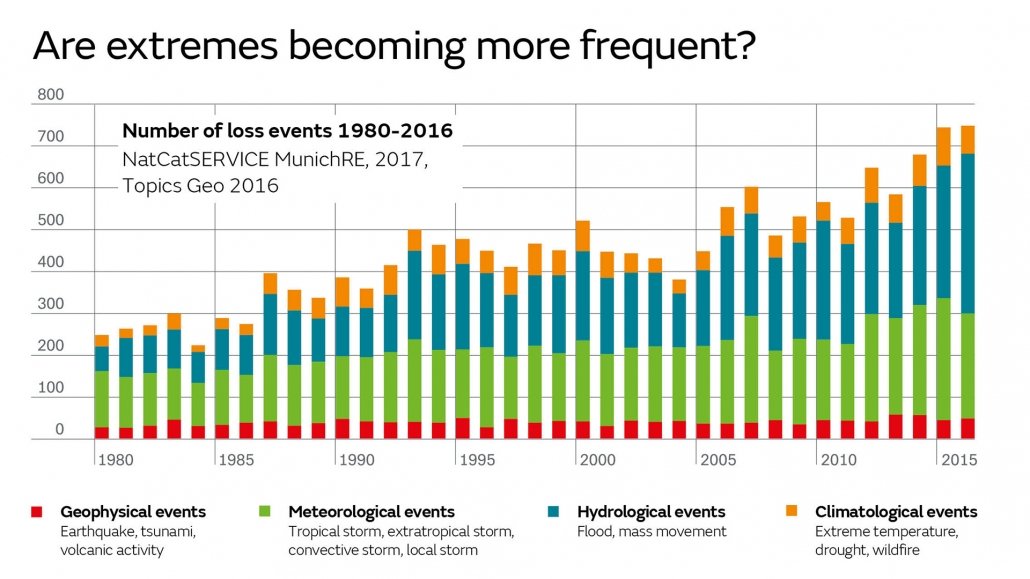
Extreme weather events are becoming more common, starting earlier and becoming more intense.

The graph below shows an increasing trend in meteorological (storm), hydrological (flood) and climatalogical events (extreme temperature).

Graph to show increasing trend of extreme events

Are extreme events becoming more regular? source – Met Office

The Intergovernmental Panel on Climate Change Fifth Assessment Report (2014) showed that changes in many extreme weather and climate events have occured since about 1950.

There is evidence that humans have contributed to changes in temperature extremes, heavy rainfall events, and an increase in extreme high sea levels in a number of regions.

Extreme weather does not prove the existence of a warming earth, but climate change is likely to exaggerate it. According to the Intergovernmental Panal on Climate Change (IPCC) “a changing climate leads to changes in the frequency, intensity, spatial extent, duration and timing of extreme weather and climate events, and can result in unprecedented extreme weather and climate events,”.

Based on more than 150 studies into the link between human action and weather events around the world the following conclusions have been drawn:

  • Extreme heat: Almost all studies on extreme heat events indicate human influence.
  • Drought: About half the studies on drought show significant human influence.
  • Extreme rainfall: A smaller but increasing number of studies on extreme rainfall detect a human signal.
  • Tropical storms and hurricanes: The picture here is complex. There is strong evidence that increasing sea temperatures increase the intensity of tropical storms. Rising sea levels also increase the risk of coastal flooding. However, there may be an overall decrease in the global total number of tropical cyclones.

A study published early in 2019 by the Swiss Federal Institute of Technology in Zürich said the summer heatwave that occurred across northern Europe last year would have been “statistically impossible” without climate change driven by human activity.

The impact of coastal erosion at Hemsby

On December 5th 2013 the east coast of England was affected by flooding not seen on a scale since 1953. The combination of a high spring tide, an area of low pressure and high northerly winds was responsible for the floods. On the Holderness Coast, a large section of Spurn Point was eroded, leading to the destruction of dunes and collapse of the road linking the spit to the mainland.

In Lincolnshire 1,400 homes were flooded, including 300 in Boston, Lincolnshire, according to Environment Agency (EA) figures.

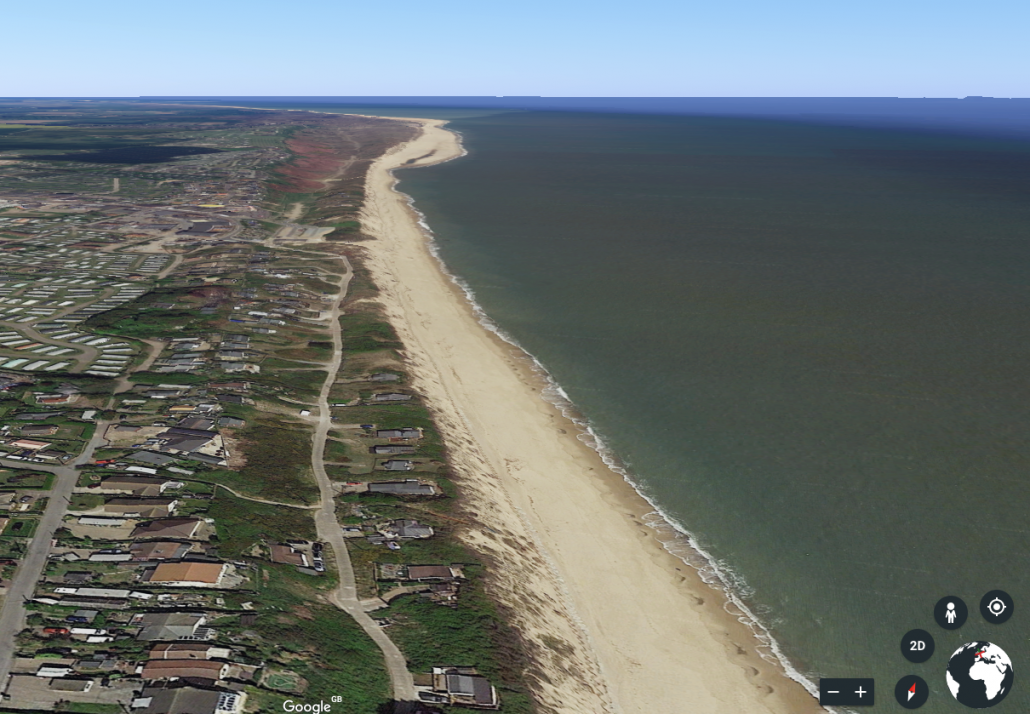
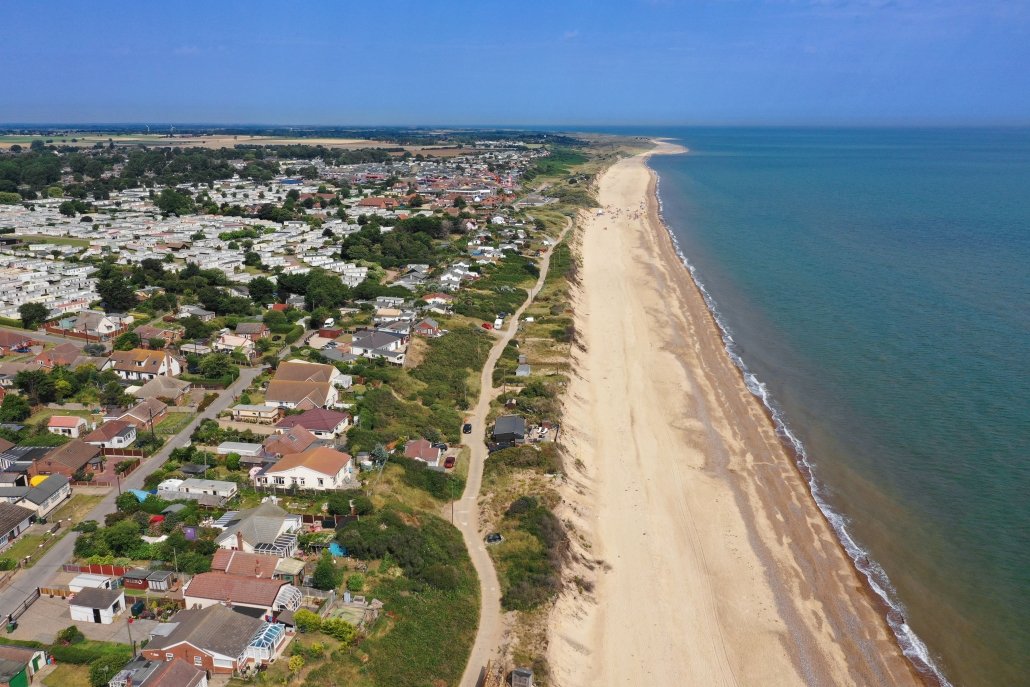
Further south at Hemsby, on the Norfolk coast, seven properties fell into the sea. Since the storm surge in 2013 and subsequent ones in 2017 and 2018, a considerable number of bungalows were perilously close to the sea. Seven homes on The Marrams in Hemsbey were demolished in March 2018 when they were left uninhabitable due to the collapse of the sandy cliffs.

The Google Earth image below, taken on 5th November 2017, shows The Marrams. The image shows some of the remaining properties in 2017.

Hemsby on 5-11-2017

Hemsby on 5-11-2017

However, the recent aerial photograph taken on 25th July 2019 shows just one property remaining.

Hemsby on 25-07-2019

Hemsby on 25-07-2019

An environmental impact assessment, completed early in 2019, will pave the way for planning permission for a “rock berm” to be put in place.

According to the BBC “Once planning permission is granted, the process will begin to raise the money needed to install the rock berm, likely to cost between £3m and £9m.”

Funding for the project will be a combination of local business contributions and central government.

Sandsend Coastal Protection Scheme – What is the unintended consequence?

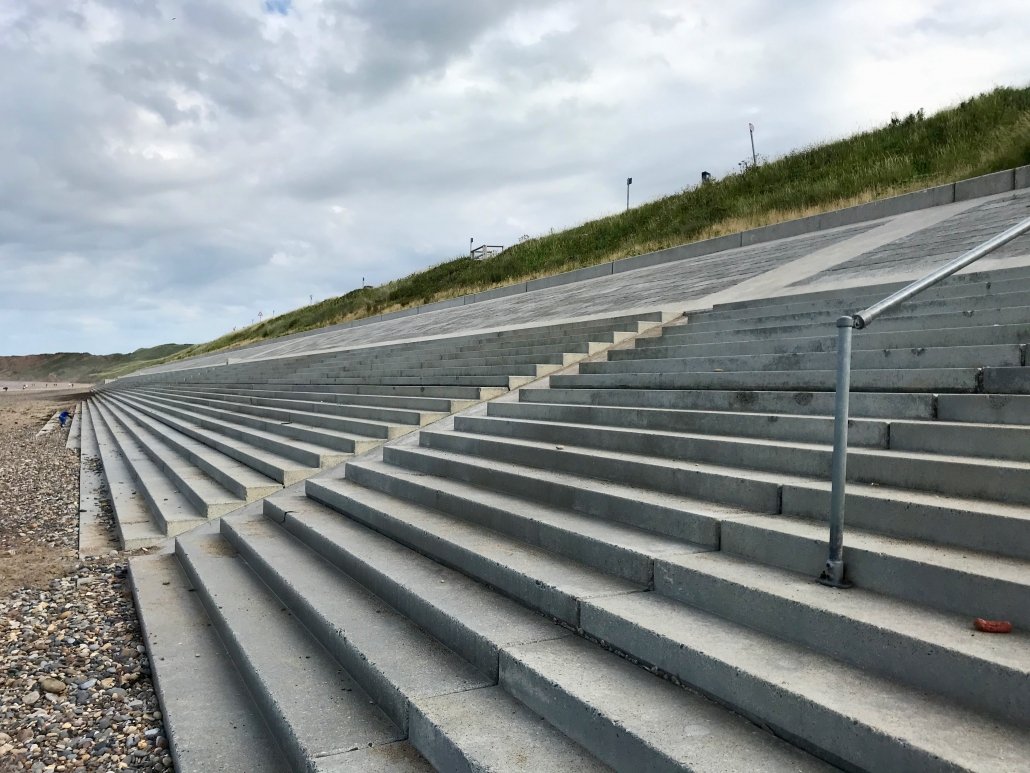
In 2016 hard engineering defences were constructed between Whitby and Sandsend. Concrete steps, replacing damaged defences, now protect the 800m section of the coast.

Concrete steps at Sandsend

Concrete steps at Sandsend

The defences have been designed to protect the A174 Sandsend Road between Whitby and Sansend. Soft engineering solutions, such as the stabilisation of the boulder clay cliffs have also been introduced. The new coastal defences protect the main road from closure. The image below shows the newly reprofiled cliffs with vegetation to secure the cliff.

Sandsend cliff stabilisation

Sandsend cliff stabilisation behind the A174

The £9 million project is a partnership development between The Environment Agency and North Yorkshire County Council. The defences avoid regular road closures previously caused by boulder clay landslips in winter and during periods of bad weather.

Work on the lower sections of the new scheme involved building 450 steps using an innovative system that carried concrete along a rail built into the defences.  The concrete mix was strengthened by mixing 5mm plastic filaments.

However, subsequent poor weather and strong winds have caused erosion to the sea wall exposing the plastics. Estimates suggest that this is happening over 75% of the structure. Erosion is evident at the bottom of the structure, which is continuously in contact with the sea and beach. As a result of this, plastic filaments are now standard on the beach.

Plastic filaments at Sandsend

Plastic filaments at Sandsend

Critics of the scheme are campaigning to avoid the use of similar construction techniques in the future.


Garmin eTrex vs iPhone for GPS accuracy

During a CPD session at Hornsea on Friday 21st June 2019 I recorded the location of the cliff edge adjacent to Longbeach Leisure Park using an iPhone and a Garmin eTrex 30 GPS device. I was keen to find out how the iPhone and the dedicated GPS device compared. 

The map below shows the routes recorded by both the iPhone 7S and the Garmin eTrex. On the map below the Garmin route is plotted using a blue line and the green line shows the route recorded by the iPhone. It is clear that the iPhone GPS is, in some instances, around 5m out compared to the Garmin eTrex. In some cases the route is recorded over areas of cliff that no longer exist. The start location of the iPhone is out by quite some distance despite starting the routes at exactly the same time. The iPhone records waypoints more often I’m sure there is a setting in the Garmin to adjust how often waypoints are recorded (I’ve just started playing this). 

It is possible to display the recorded route of the coastline that I recorded on the same iPhone back in March. Comparing the two routes recorded on the iPhone, there are clear inconsistencies where the cliff edge appears to extend outwards since the last recording! 

It is worth noting that both devices were held in the same hand at the same time. I’m not sure if GPS signals from different devices can interfere with each other, further reading to do on this. 

As expected the dedicated GPS device is considerably more accurate at recording routes than the iPhone. However, the iPhone is perfectly adequate for regular leisure use. 

Anthony Bennett

Wider Geography Summer Challenge

What is Wider Geography?

Wider Geography is a free, new project developed by Internet Geography to encourage young people to engage in geography in a fun way. Wider Geography aims to foster a love of geography through challenging young people to try new experiences that will broaden their geographical horizons. Through its six themes, wider GEOGRAPHY has something for geographers from primary age to 6th form. The 6 main themes are:
Each theme recommends activities for students to try out.

Wider Geography Summer Challenge

Internet Geography has launched the Wider Geography Summer Challenge. We’re inviting schools to encourage students to participate in the Wider Geography Summer Challenge. The challenge involves students experiencing a range of Wider Geography activities over the summer holidays. They record their experiences on the table on the back of the wider GEOGRAPHY Summer Challenge flyer. They can then submit a 400-word overview of their experience of the Wider Geography Summer Challenge. Three winners will be chosen from the submissions. Each winner will receive prizes including a £30 Amazon voucher.

How can teachers and schools use Wider Geography?

Below are some suggestions of how teachers and schools can use Wider Geography to encourage young geographers to participate.
1. Primary schools can set the challenge as a project over the summer holidays
2. Secondary schools can set the challenge as a transition activity for year 6 students
3. Secondary school geography departments can set the Wider Geography Summer Challenge as a summer project
3. Hold a school-wide competition and submit the best 400-word overviews to Internet Geography
We’ve created a flyer to share with parents to let them know about the Wider Geography Summer Challenge. Download the Wider Geography Summer Challenge flyer. You can also download an A3 Wider Geography Summer Challenge poster for your classroom.

How can you support Wider Geography?

We are looking for more suggestions for activities to add to those we’ve come up with so far. You can see these by going to www.internetgeography.net/wider
We are also seeking prize donations for the winners of the Wider Geography Summer Challenge. If you can help with either of these please contact us at [email protected] Finally, if you use social media such as Twitter it would be appreciated it if you could help promote Wider Geography using the hashtag #widergeography.

Scaffolding to tackle alien questions

Having recently read Mark Esner’s post on the TES on Scaffolding: are you using it properly? it reminded me about a scaffolding strategy I’ve used in the past to tack alien ‘questions’.


You’ve crafted and delivered a fantastic set of lessons where students have soaked up knowledge and developed their understanding around a particular topic only to crash and burn when faced with an extended exam question.

Sound familiar?

Then you’ve experienced the scourge of the classroom – the alien question. Alien questions are usually greeted with blank expressions, quickly followed by the looks of pure panic. Despite having developed incredible subject knowledge, applying this to an exam question that students don’t understand is a near impossibility.

Having experienced the curse of the alien question in the classroom, I quickly realised students need to dissect exam questions to apply their skills, knowledge and understanding. This led to the development of a resource that provides students with scaffolding in completing alien questions. Enter DISSECT to Alien Questions. DISSECT is a simple acronym to help students remember how to attempt an alien question:

  1. Decipher the question
  2. Identify facts
  3. Sensible Structure
  4. Examples
  5. Command words
  6. The conclusion
DISSECT the exam question

DISSECT the exam question template

The modelling starts with working out what the exam question is asking. This is followed by identifying examples, such as case studies, that will be included in the answer. Next, the key facts that will be included in the response are recorded. A simple structure is then be planned. Finally, a brief plan for a clear and concise conclusion is recorded. Of course, the model is flexible in terms of the order taken to prepare an answer. For example, planning the conclusion may come before planning the structure.

Below is an example of scaffolding for an alien question that has been live modelled with students.

Example DISSECT the exam question

Example DISSECT the exam question

Eventually, the scaffolding needs to be removed in order for students to be able to tackle alien questions independently. After all, they can’t take the framework into the exam with them. So, how might this be achieved? Below are a series of steps that could be taken to help achieve this:

  1. The teacher models the thinking process they would go through in completing the alien exam question using the template;
  2. Repeat this several times with different exam questions;
  3. Students work in small groups using the template to plan an answer to an alien question. They then rotate around the class looking at other group’s plans and add annotations;
  4. Students complete the template in pairs, then share with other couples to get feedback;
  5. Students use the model independently;

This would occur over an extended period as students will need several experiences using this approach until it is embedded.

Download the template and example below:

DISSECT template

DISSECT earthquake example

If you model any examples using this technique please send a copy over to share via [email protected]

Anthony Bennett


Hornsea Slumping 3D Model

The 3D model below shows mass movement, in the form of slumping, to the south of coastal defences at Hornsea on the Holderness Coast. The image shows a 50m section of boulder clay cliff adjacent to the caravan park slumping. At its widest point 8m of the cliff top was lost. Click play to explore the model.

The aerial images were captured using a DJI Mavic Pro. These were then rendered into a 3D model in Photoscene then uploaded to Sketchfab.

Climate Change The Facts

Climate Change – The Facts is a 2019 British documentary presented by David Attenborough that discusses the causes, effects and solutions to climate change.

Climate Change the Facts is available on iPlayer until the 18th Map 2019.

I’ve put together a comprehensive list of questions and answers that can be used in the classroom. Feel free to edit the document. I went a bit OTT with questions!

Download the question sheet


Christchurch Earthquake Animated Map

Christchurch earthquake map is a fantastic resource for illustrating the swarm of earthquakes that occurred on February 22nd 2011, when 185 people were killed as the result of a magnitude 6.3 quake.

To access the resources head over to the Christchurch earthquake map

Christchurch Earthquake Animated Map

Christchurch Earthquake Animated Map

Next, click February 22, 2011 under quick links (on the left of the page). The animation will start automatically. The magnitude and depth of the earthquakes are illustrated using coloured proportional circles.

2011 Christchurch Earthquake Map

2011 Christchurch Earthquake Map

You can speed up and slow down the animation using the media controls to the top right of the page.

We’ve recently added Christchurch earthquake case study resources on Internet Geography.

Coastal Environments CPD – Erosional Landforms, Coastal Management and Fieldwork on the Holderness Coast