Improve Geographical Skills with Skills Plus

Feedback from the recent AQA GCSE Geography examiner’s report suggests that geographical skills are an area for development. Given that geographical skills are worth 10% of the GCSE, across three papers, we’ve been thinking about how Internet Geography Plus can support you in improving students’ geographical skills. Considering so many skills are covered in the AQA GCSE specification, we felt a quick fix wouldn’t be enough. Therefore, this year, we are developing several sets of resources to support you, including:

  • Skills Plus
  • Skills Plus Baseline Assessments

What is Skills Plus? 

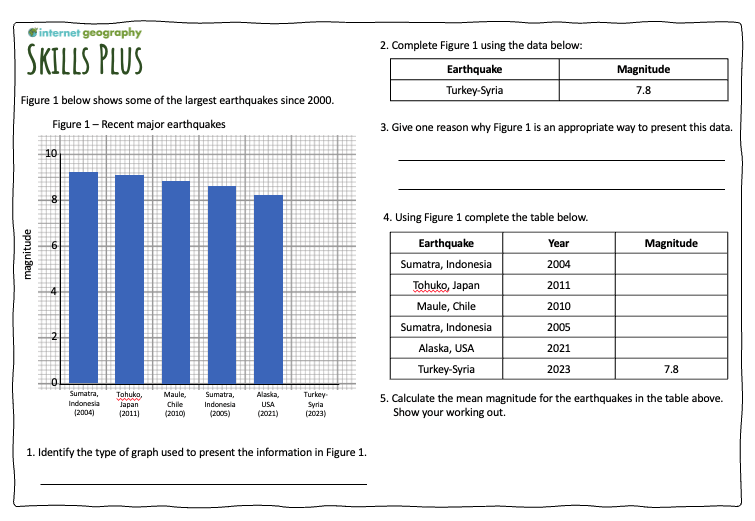
Skills Plus is a collection of activities that focus on applying geographical skills in the context of the units covered by the specification. Each Skills Plus sheet focuses on one or two skills, and questions are based on a particular unit. They are short, focused activities that can be used as starter or plenary activities. They can also be issued to individual students if there is a particular area for development identified from assessments or intervention sessions etc. Each Skills Plus resource is editable and includes a mark scheme to reduce your workload.

An example of Skills Plus resource

An example of a Skills Plus resource

Subscribers can access the first of these resources in the new Skills Plus area of Internet Geography Plus. We’ll be adding new Skills Plus resources regularly over the coming year. If you have a specific request, please get in touch. Not got access to Internet Geography Plus? Please purchase a low-cost annual subscription to access these and over a thousand other resources.

Skills Plus Baseline Assessments

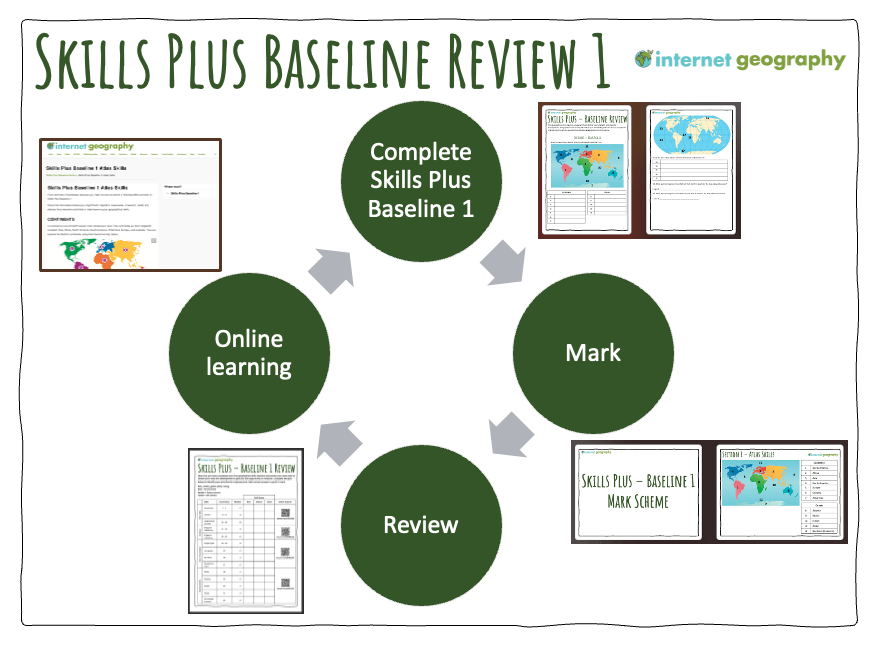
As well as Skills Plus, we are developing a comprehensive, planned approach to developing geographical skills through our new Skills Plus Baseline Assessments. The approach involves:

  • Students complete a baseline assessment covering various geographical skills.
  • Students assess their performance (a mark scheme is provided, including a PowerPoint that can be used to take the students through the answers).
  • Students complete a review sheet to RAG rate their performance across the different skills (a PowerPoint is also available for you to deliver this)
  • Students use QR codes/web links to access resources on Internet Geography to support improving their identified areas for development.
  • The assessment can be repeated later to review progress.

We’ll be adding a number of Skills Plus Baseline assessments to Internet Geography Plus over the coming year, which review the range of geographical skills identified in the specification (and a few relevant extras). As there are so many skills to cover, we have decided to divide the skills and produce a series of baseline assessments this academic year.

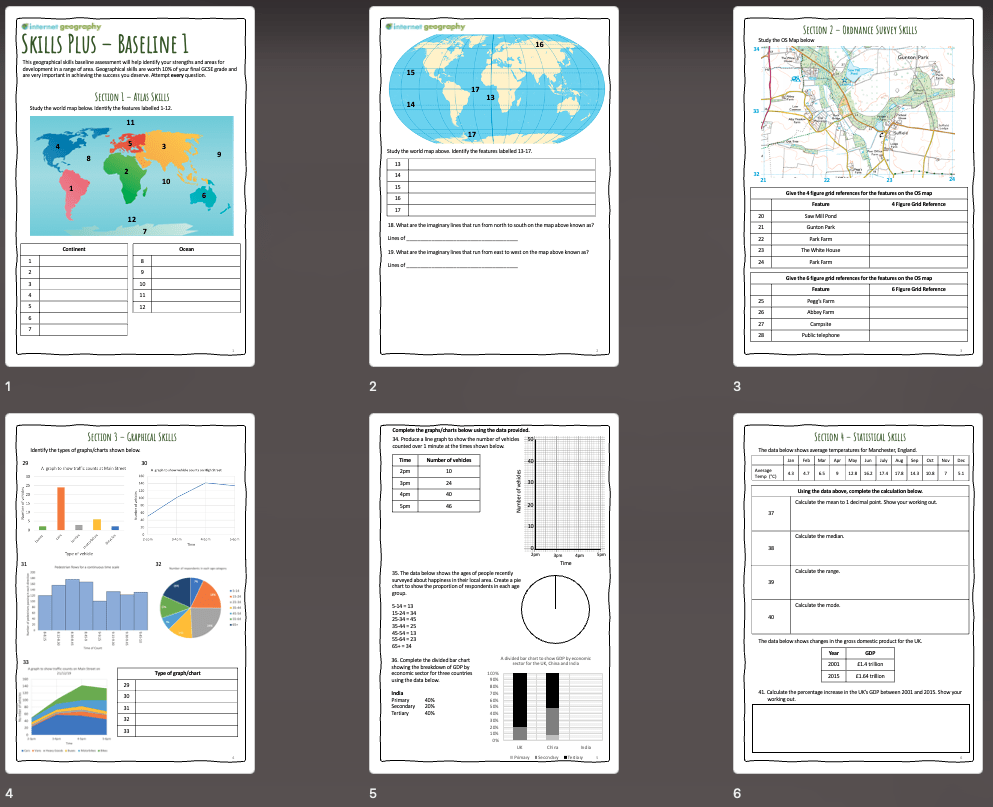
The first Skills Plus Baseline Assessment (see image below) is now available to Internet Geography Plus subscribers.

Skills Plus Baseline Assessment 1

Skills Plus Baseline Assessment 1

The first Skills Plus Assessment addresses relatively basic geographical skills students should know. However, we have included a couple of more challenging elements so that most students will have areas for development!

Each Skills Plus Baseline will cover a range of atlas, OS maps, graphical, and statistical skills.

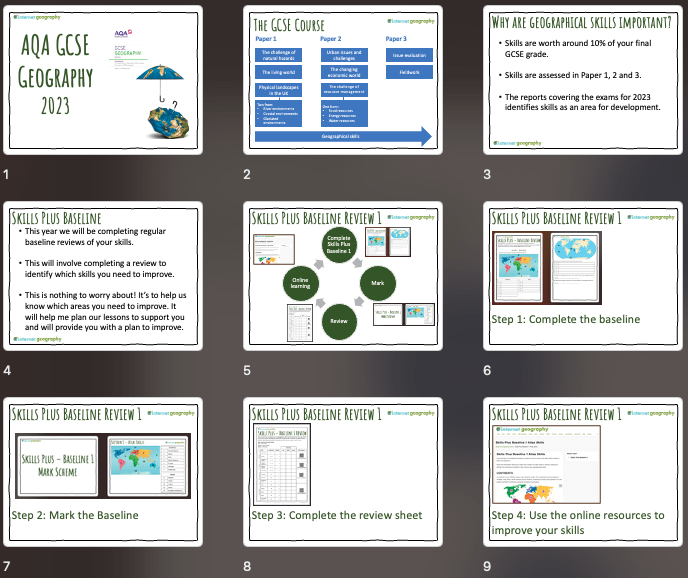
An introduction PowerPoint is available to download to support you in launching the Skills Plus Baseline.

A screenshot showing the skills Plus Baseline teacher presentation

Skills Plus Baseline teacher presentation

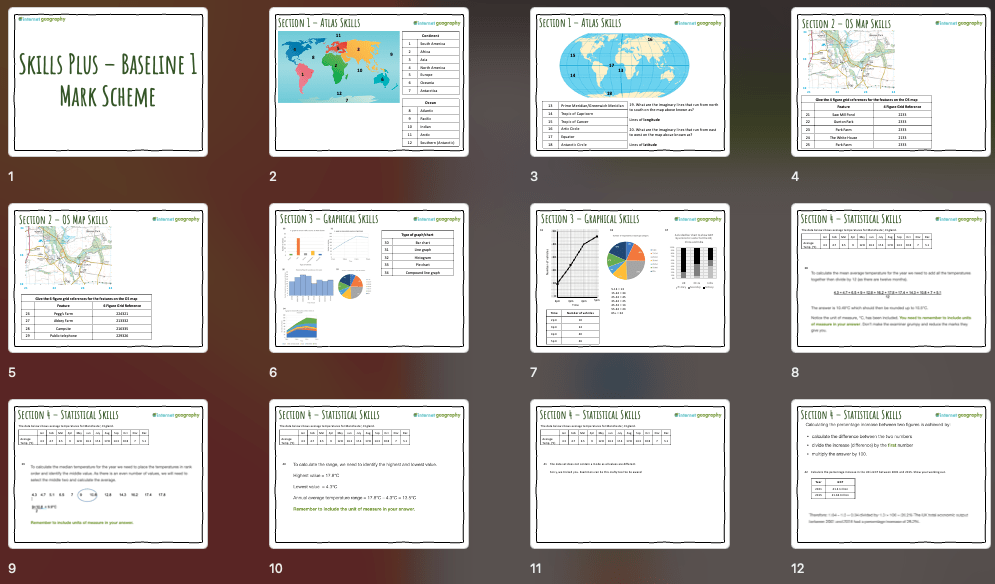
Once the students have completed the Skills Plus Assessment, they will self-assess using the provided mark scheme, which includes a PowerPoint presentation that you can use to take the students through the processes.

Skills Plus Baseline 1 Mark Scheme PowerPoint

Skills Plus Baseline 1 Mark Scheme PowerPoint

Students then review their performance using the Skills Plus Baseline Review (see below). There is a PowerPoint to guide students through this process on Internet Geography Plus.

Skills Plus Baseline Review

Skills Plus Baseline Review

The completed review sheet will help students identify their priorities for skills development. The review sheets include a QR code/link to free-to-access online resources on Internet Geography that students will use to improve their geographical skills. These pages are now available to access.

We’re working on a spreadsheet to identify which geographical skills are covered in this and future assessments. Hopefully, it will be a helpful tracking tool that provides a clear overview of the skills that have been/will be covered. It can also be shared with those delightful OFSTED people, if you are lucky enough to have a visit, to illustrate how you are taking a systematic approach to skills development.

Skills Plus Tracking Sheet

Skills Plus Tracking Sheet

Subscribers can now access the new Skills Plus Baseline and Baseline Review in the new Skills Plus area of Internet Geography Plus. Mark schemes and presentations will be added later today.

We’ll be adding further baseline assessments over the coming year. If you have a specific request, please get in touch. Not got access to Internet Geography Plus? Please purchase a low-cost annual subscription to access these and over a thousand other resources.

2023 – A Summer of Extreme Weather

New National 5 Geography Weather Resources

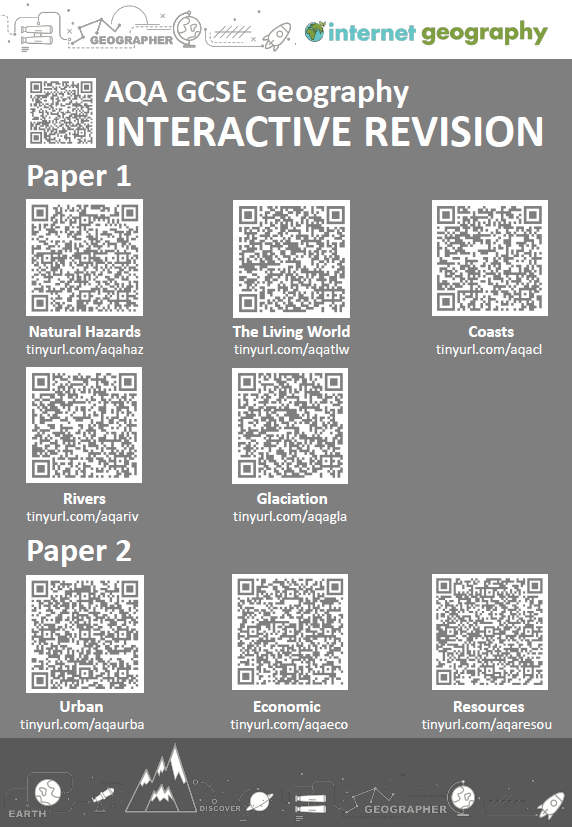
AQA GCSE Geography Interactive Revision Resources

Did you know? Students can access a growing collection of free interactive resources on Internet Geography to support revision and retrieval.

We’ve compiled a PDF file you can share with students containing QR codes and short URLs so they can get straight to the area they want to revise. Just click the image below to download.

AQA GCSE Geography Interactive Revision - Click to download

India is close to passing China to become the world’s most populous nation

According to data from the United Nations, India is on track to surpass China as the world’s most populous country by June 2023. India’s population is projected to reach 1.4286 billion, approximately 2.9 million more than China’s 1.4257 billion. The two Asian countries have represented over a third of the global population for over seven decades.

China’s birth rate has recently plummeted, decreasing its population last year for the first time since 1961. The United Nations Population Fund (UNFPA) State of World Population Report’s forecast for India is estimated, as no census has been conducted in the country since 2011. The 2021 census was cancelled due to Covid and rescheduled for 2022, but it has now been postponed again to 2024.

The UN’s Chief of Population Estimates and Projection, Patrick Gerland, said that any numbers regarding India’s actual population size are “naïve assumptions based on fragmentary information,” as no official data is available. Furthermore, the UN’s estimate does not account for the populations of China’s Special Administrative Regions, Hong Kong and Macau, or Taiwan, totalling over 8 million people.

In November, the global population surpassed 8 billion, but experts note that growth has slowed considerably, reaching its lowest rate since 1950.

One of the primary reasons for India’s increasing population has been the difference in fertility rates between the two countries. Historically, India has had a higher fertility rate than China, which means that, on average, Indian women have more children than their Chinese counterparts. Over the past few decades, both countries have experienced a decline in fertility rates, but India’s rate has remained higher than China’s.

China’s strict population control measures, mainly the one-child policy implemented in 1979, significantly curbing population growth. The policy was relaxed in 2015, allowing couples to have two children, but the impact of this change on China’s population growth has been limited. In contrast, India has implemented various family planning initiatives, but it has never adopted a stringent policy like China’s one-child rule. This difference in approach has contributed to India’s higher fertility rates and overall population growth.

Another critical factor in India’s population growth is its age structure. India has a relatively young population, with a median age of around 28 years, while China’s median age is approximately 38 years. This youthful population means that there are more people in their reproductive years in India, which contributes to a higher number of births and subsequent population growth.

Rural-to-urban migration has been another driving force behind India’s population growth. In search of better opportunities and higher living standards, millions of Indians have migrated from rural areas to urban centres, leading to rapid urbanization. While urbanization has also occurred in China, India’s urban population growth has been more pronounced. The increased population density in cities has contributed to higher fertility rates in urban areas, further fueling population growth.

Socio-cultural factors have also played a role in shaping the population trends of both countries. In India, there has been a preference for larger families, particularly in rural areas, where children are often seen as economic assets which can contribute to the household income. Furthermore, the preference for male children has led some families to continue having children until they have a son, contributing to higher fertility rates.

A UNFPA-commissioned survey found that most Indians believe their population is too large and fertility rates too high, with nearly two-thirds of respondents citing economic concerns related to population growth. However, demographers argue that India’s population overtaking China’s should not be seen as a concern but as a symbol of progress and development, as long as individual rights and choices are respected, as stated in the UN report.

Further Reading

UN World Population Prospects 2022


Untreated Sewage and Our Rivers and Seas

In 2022, water firms in England discharged untreated sewage into rivers and seas for over 1.75 million hours.

According to data, there was an average of 825 daily sewage spills into water bodies, a 19% decrease from the year before.

However, the Environment Agency attributes this decline mainly to a drier climate rather than proactive measures taken by water companies.

While not against the law, scholars and environmental organizations argue that discharging sewage threatens public health.

During periods of heavy rainfall, water companies release sewage to alleviate the pressure on their treatment facilities.

Untreated wastewater contains human excrement, wet wipes, and sanitary items, all of which present significant hazards to local wildlife, swimmers, and others who utilise UK waterways.

Professor Jamie Woodward, a geography expert at the University of Manchester, stated that these discharges “degrade valuable ecosystems and pose a danger to public health.”

He explained that each release is “a toxic mix of various pollutants, including microplastics and pathogens.”

Was sewage discharged near you?

Click the map below to investigate sewage discharge near you.

Sewage discharge in England and Wales

Sewage discharge in England and Wales – Link to the Rivers Trust

New information recently released by the Environment Agency was obtained from monitoring stations located at combined sewer overflows, or CSOs. CSOs were designed as overflow valves to minimize the likelihood of sewage backups during periods of intense rainfall, which can cause sewer pipes to become overwhelmed and result in flooding.

These valves discharge a combination of untreated sewage originating from residential and commercial properties, as well as rainwater runoff.

Although the data indicates a 34% decrease in the duration of spills since 2021, John Leyland, the Environment Agency’s executive director, stated that the reduction in the previous year was “primarily due to dry weather, not water company action.”

He further emphasized the need for accelerated progress from water companies in minimizing spills and acting on monitoring data.

The data revealed that United Utilities, servicing the North West of England, had the highest number of sewage releases in 2022. The company discharged sewage for close to half a million hours.

The Environment Agency and water regulator Ofwat is investigating six water companies for potential breach of the law over their discharges.

The government has pledged to tackle sewage spills by making water companies invest £56 billion over 25 years to enhance their infrastructure. Additionally, they must equip all storm overflows in the network with event duration monitoring (EDM) devices by the end of the current year.

Many people feel this is not enough to tackle sewage discharge in rivers and seas.

The graph below shows the status classification of surface water bodies (rivers, canals, lakes, estuaries and coastal water bodies) in England. The graph shows the percentage of water bodies with high, good, moderate, poor or bad ecological potential. A good status means a body of water has a slight variation from undisturbed conditions, meaning it is almost as it should be naturally.


There has been a decrease in the proportion of surface water bodies in England awarded high or good ecological status since the indicator was first prepared in 2009; the indicator has also declined in the short term, between 2015 and 202. In 2021, 16% of surface water bodies assessed under the Water Framework Directive (WFD) were in high or good status compared with 17% in 2015 and 25% in 2009.

Case Studies and Examples with Web Links

Jason Bowsley of Baysgarth School has kindly shared a useful editable document to support students with case studies and examples, including the name of case studies/examples for each section of the specification with a web link, quiz link and video link.

Case studies and examples with web links


Click the image above to download, and give Jason a follow on Twitter.

AQA GCSE Geography Pre-release 2023

This page will be regularly updated over the coming days!

The Cayman Islands

How developed is the Cayman Islands?

The Cayman Islands is a high-income country. The graph below shows the GNI per capita for the Cayman Islands between 2010 and 2020.

Overview of the Grand Cayman cruise port proposal

The plan aimed to develop a new cruise port in George Town, Grand Cayman, to accommodate the larger Oasis-class cruise ships that cannot dock at the existing port facilities. However, there may have been new developments in the project since then.

The project faced opposition from environmentalists and some residents concerned about the potential negative impacts on the environment, particularly coral reefs and marine life. Moreover, critics argued that the increased number of tourists could strain local infrastructure and services, leading to overcrowding and a decline in the quality of life for residents.

Proponents of the project argued that the new cruise port would bring significant economic benefits to the island, including job creation, increased tourism revenue, and a boost to local businesses. They also pointed out that the design and construction of the port would include measures to mitigate environmental impacts.

In the face of the COVID-19 pandemic, the then government (People’s Progressive Movement – PPM) abandoned the proposals.

The government has changed since the proposal was made. The new premier, Alden McLaughlin, has repeatedly stated that his government will not pursue this project during the remainder of this administration. He has also said there will be no commitment to build a cruise ship dock in the ‘coalition’ manifesto. In a reversal of his staunch support for cruise tourism, McLaughlin said the business community and the wider public have made it clear they want a more balanced approach to the overwhelming numbers that come with the cruise ships.

Arguments have been made for the greater diversification of tourism on the island, including the development of medical tourism. May residents were keen not to return to mass tourism through cruise ships.

Videos

Links

Cruise port for the largest Carnival and Royal Caribbean Ships (Grand Cayman)

Should the Cayman Islands’ new cruise port facility project go ahead?

Internet Geography Plus AQA GCSE Geography Pre-Release 2023 Survey

The AQA GCSE Geography paper 3 pre-release will soon be available to schools. As usual, Internet Geography Plus subscribers will be able to access support materials for teaching the pre-release.

Please take a minute to complete the survey below to help us prioritise the resources we develop.

Coastal Erosion at Hemsby: A Battle Against Nature

Coastal Erosion at Hemsby: A Battle Against Nature

Coastal erosion is a natural process that happens worldwide, but it has become a pressing issue for the residents of Hemsby, a village on the Norfolk coast. So, buckle up as we explore the science behind coastal erosion, how it’s impacting Hemsby, and what’s being done to fight it.

What is Coastal Erosion?

First, let’s understand what coastal erosion is all about. Coastal erosion is the wearing away of the land by the sea, often involving destructive waves wearing away the coast.

Coastal erosion is a natural process that shapes and reshapes the world’s shorelines. However, human activities, like building structures near the coast or interfering with natural habitats, can speed up erosion or worsen it.

The Hemsby Situation

Hemsby, located on the Norfolk coast in the UK, has been struggling with coastal erosion for quite some time. The village has a beautiful stretch of sandy beach that attracts tourists and provides a livelihood for local businesses. However, the coastline has steadily disappeared, putting homes and businesses at risk.

The Location of Hemsby

The Location of Hemsby

The village has lost about 70 meters of coastline in the last 50 years. But the erosion has become even more severe in recent years, with storm surges and high tides causing rapid damage. In March 2018, a powerful storm known as the “Beast from the East” battered the coast, causing seven homes to fall into the sea.

The Impact on Hemsby

Coastal erosion is not just about losing land – it also affects the people living and working in Hemsby. The community’s stability is shaken as homes and businesses are threatened. Moreover, the tourism industry, a crucial part of Hemsby’s economy, could take a hit if the beautiful sandy beaches disappear. About 90% of Hemsby’s economy depends on tourism.

March 2023


In the last few weeks, five homes have been demolished at Hemsby. Recent erosion on the coast has led to several properties built on sand dunes in the village of Hemsby, teetering on the edge and part of an access road being washed away. High spring tides (3.7m) and strong winds (50 mph) have battered the coastal stretch at The Marrams during the last two weeks.

One property was 20ft (6.1m) from the cliff edge a week before the high tides and strong winds, and then there was just 3ft (0.9m).

Demolition work by Great Yarmouth Borough Council is taking place on the north side of Hemsby Gap – a break in the dunes used by lifeboat crews to access the beach.

Coastal erosion at Hemsby - photograph taken in July, 2019.

Coastal erosion at Hemsby – photograph (© Internet Geography) taken in July, 2019. Satellite image from Google Maps.

Timeline 

25th February 2023 – The beach at Hemsby was closed because of significant erosion 

10th March 2023 – At-risk homes were evacuated due to fears properties could topple over the cliff. A high tide led to a playhouse and shed falling over the cliff. 

11th March 2023 – The first home was demolished.

12th March 2023 – Two more homes were demolished

13th March 2023 – Two more homes were demolished. 

15th March 2023 – The access road to the south of Hemsby Gap closed due to its collapse

16th March 2023 – One homeowner managed to get his property moved from the cliff edge

What is being done to protect Hemsby?

About 2,000 tonnes of granite rock armour is being added to the beach south of Hemsby Gap as a temporary solution to protect clifftop road access to several properties. Great Yarmouth Borough Council sought permission from the landowner to put granite rocks on the beach. The granite blocks will break the waves and absorb their energy.

Hemsby Lifeboat coxswain Daniel Hurd told the BBC the current situation could have been resolved earlier.

He said: “I just think it’s absolutely ridiculous, this has been an emergency for years and it’s taken this weekend for them to see it’s an emergency to then get a rock berm put on the beach.”

The council responded saying it was a “real minefield of making sure that what local government and the authorities do is the correct line of procedure”.

Noel Galer, Great Yarmouth Borough councillor for East Flegg ward, which includes Hemsby, told Sky News people will be “trying very hard” to look after those who have lost their homes.”Some people literally have a second home which happens to be very close to the beach.

“Perhaps they knew the risks and understood the risks, accepted the risks.

“Others for various reasons may have found this is the only place they can find to live because of the cost and their circumstances and may not be so aware of what’s going on.

“They may have felt there’s no way this is ever going to be washed away.”

He said there used to be two further rows of dunes and that there is a footpath on the local map which goes out to sea.

Following the demolitions, four hundred people attended an emergency meeting in Hemsby to discuss action to help protect the village’s crumbling coastline. The Hemsby Independent Lifeboat and Save Hemsby Coastline organised the meeting. The group have started a petition to get the government to take responsibility to help save Hemsby’s coastline, residents were invited to join a protest outside Westminster or Downing Street in the future, and a “war chest” to fund legal assistance had opened.