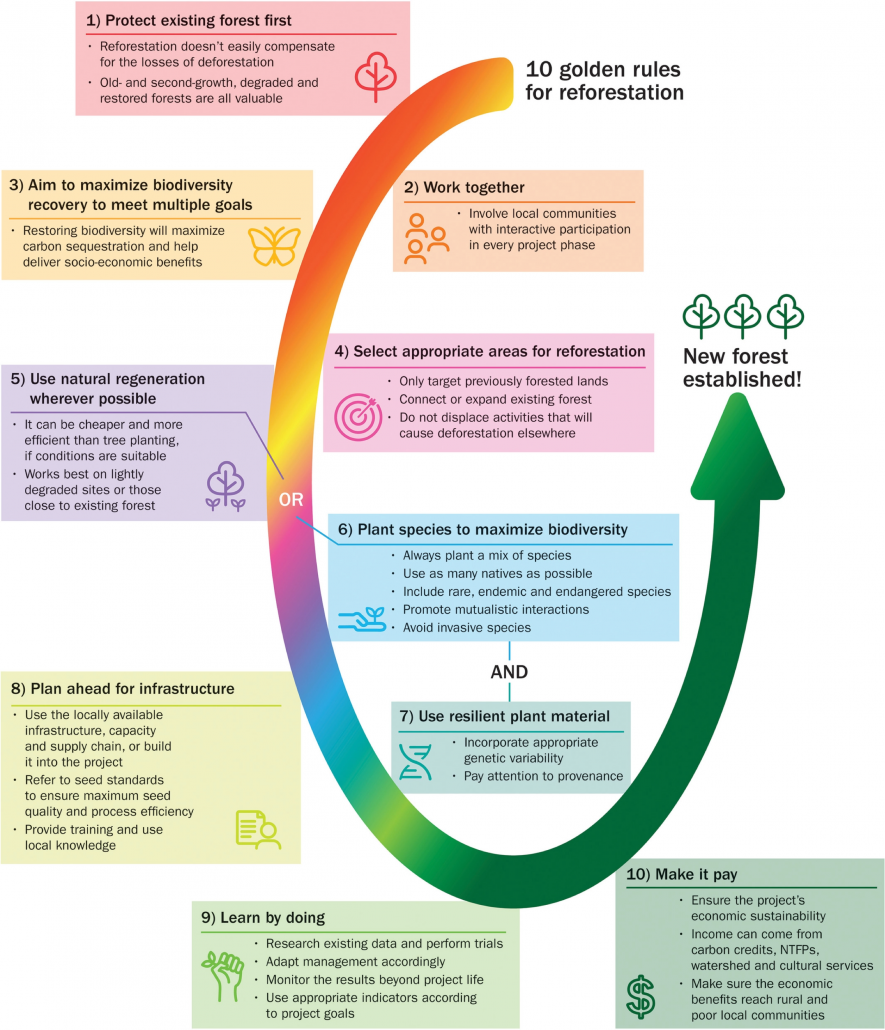
Coastal erosion at Skipsea
Skipsea is a village located 6 miles north of Hornsea and 10 miles south of Bridlington on the Holderness Coast, East Yorkshire. Skipsea lies on soft boulder clay and experiences the highest rate of erosion in Europe. A combination of stormy weather and rising sea levels caused more than 10 metres of the cliff to disappear from a 2-mile stretch of coast in just nine months last year, compared with the annual average of 4 metres. In just six months, three strips of coastline lost nearly double what they expected to lose in a year.
The average annual erosion rate remains about 2 metres a year for the 52-mile Holderness coastline. In Skipsea, there is anger that sea defences have protected neighbouring towns and villages such as Hornsea and Bridlington but their parish, with its population of about 700, has not. Sea defences are decided on a cost-benefit analysis, with large urban areas and important industries prioritised over farmland and individual houses. On that basis, Skipsea must brave the waves.
Until recently, 19 properties sat adjacent to the coast along Green Lane. Now, there are 16. It has been suggested that the remaining residents will need to vacate their properties within a couple of years. However, a single erosion event could put the properties at imminent risk within the next year.
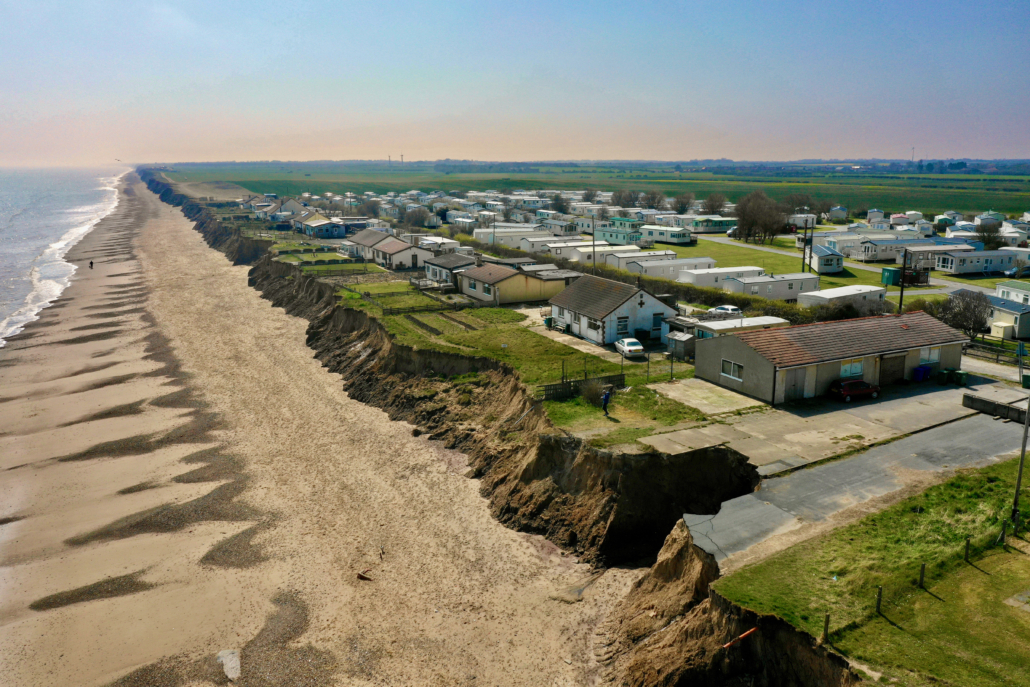
Green Lane properties at Skipsea
Some residents on Green Lane feel the council has not done enough to protect them from erosion or help them to move nearby. As it stands, they have to pay around £6000 towards the cost of demolishing their homes. The East Riding of Yorkshire council provides some financial support to help residents cover the cost of demolishing their properties – which can cost between £15,000 and £40,000 – but they are continuing to ask the Government for funding.
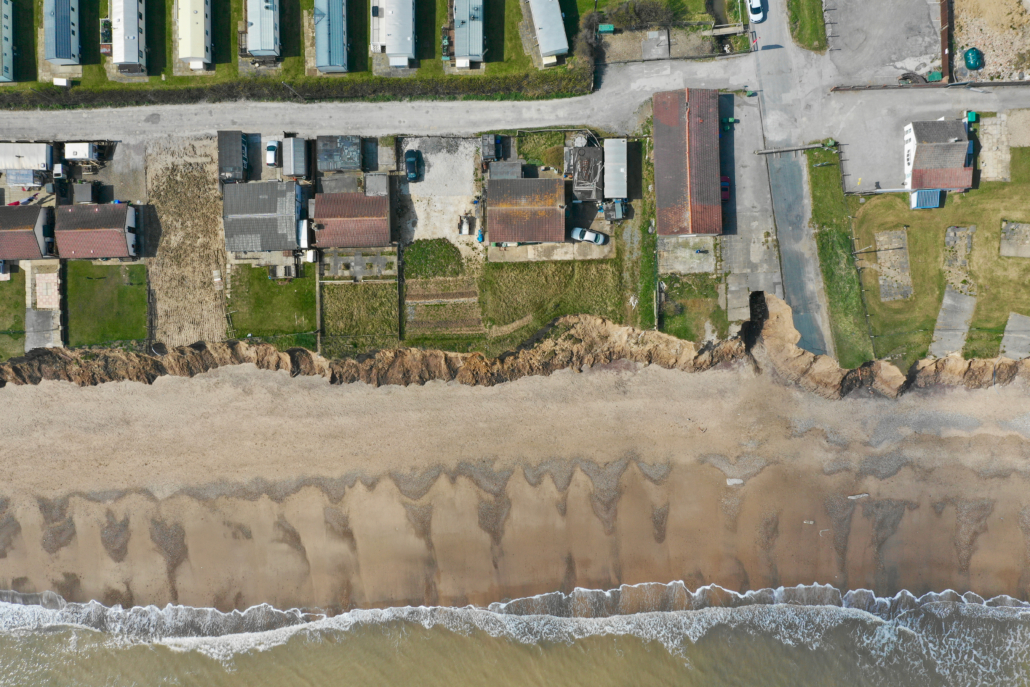
Vacant plots on Green Lane
JCQ GCSE Geography Grade Descriptors
The JCQ have published guidance for determining GCSE/A Level grades for 2021.
How much use the grade descriptors are is another question.
Below are links to published resources.
Quick links:
Guidance statement – web page
Guidance Document – PDF file
All guidance downloads – web page with links to PDFs
GCSE Grade Descriptors (all GCSEs) – PDF
GCSE Geography grade descriptors in Word format – provided by Internet Geography
Internet Geography has developed assessment materials for AQA GCSE geography, in the style of past papers and come with a comprehensive mark scheme. There are available to Internet Geography Plus subscribers. Log in here or access for one year with a low-cost subscription.
Mount Etna
Europe’s most active volcano, Mount Etna, has been hitting the headlines recently after a series of spectacular eruptions. In Etna’s first eruption of 2021, explosive lava fountains reached over 1500 m in one of the most amazing eruptions in decades.
Mount Etna, located on the island of Sicily, has been largely dormant for the past two years. The stratovolcano (composite) dominates the skyline of the Italian island, where it sits on the eastern coast.
Located between the cities of Messina and Catania, it is the highest active volcano in Europe outside the Caucasus – a region between the Black Sea and the Caspian Sea – and the highest peak in Italy south of the Alps.
The recent activity is typical of a strombolian eruption among the normal activities of the more than 3,300-metre-high volcano. The recent eruption is the strongest explosion in the southern crater since it was discovered in 1971.
On Monday 22nd February 2021, at around 11 pm, the lava fountains, surrounded by gigantic clouds of smoke, exceeded 1,500 metres (4,900ft) in height, while thousands of rock fragments, some the size of fridges, were thrown from the crater into the sky for several kilometres.
Etna is a hyperactive volcano with over 3,500 years of historically documented eruptions. The volcano has been erupting on and off since September 2013. Since September 2019, it’s been erupting from its various summit craters virtually continuously. In December 2020, Etna’s explosive activity and lava output began to spike, and in February 2021, it has been launching fluid lava skywards.
Etna is an unusual volcano in that it can produce explosive eruptions of runny lava and release slower flowing, thick lava flows. Scientists are still trying to work out why this is the case.
The magma from the latest eruption appears to be coming up from deep within the mantle. Extremely hot, fluid magma is rapidly rising through the network of conduits within and below the volcano. However, there is another factor that is contributing to the current explosive eruptions.
There are high quantities of water vapour in Etna’s magma, which makes it explosive. The water does not cool the magma. As the molten magma approaches the surface, the pressure drops, and the bubble of water vapour expands violently, leading to lava being ejected out of the volcano.
Following each explosive lava fountain, less gassy magma lingers just below the vent. This is then cleared when a new volley of gassy magma rises from below. These explosive eruptions are known as volcanic paroxysms.
Authorities have reported no danger to the nearby towns, however, local airports have been temporarily closed, as has the airspace around the volcano. Etna’s last major eruption was in 1992. Despite the explosive nature of the recent eruption, there is no risk to the population, other than from the ash that covers buildings and smoke that can, after a few hours, cause breathing problems. In March 2017 vulcanologists, tourists and a BBC film crew were injured during an eruption when a flow of lava ran into snow, producing superheated steam that sent fragments of rock flying in all directions.
Further reading
For a Volcanologist Living on Mount Etna, the Latest Eruption Is a Delight – Advisory – this article contains expletives (swear words).
In Pictures: Mount Etna eruption lights up Sicily’s night sky
Mount Etna: BBC crew caught up in volcano blast
Mount Etna illuminates night sky with 1,500-metre lava fountain
Thoughts on Catch Up
The gap between advantaged and disadvantaged students, which unfortunately exists anyway, is likely to have widened over the last year. How will the proposed funding of £80 per pupil (for all schools) narrow this gap? The gap will continue to exist if all students access ‘catch up’ (whatever that may be). According to Gavin Williamson, catch up can be academic or support mental health. Disadvantaged children will likely be in greater need of MH support. Meanwhile, those students who have had parental support throughout home-learning may be more likely to receive academic support.
If an extra couple of weeks of summer school is the magic bullet (which I don’t think it is), why has this not been proposed in recent years to narrow the gap?
Imagine being a student returning to school after this challenging period, where many have struggled with isolation and home learning, to be told you now need to ‘catch up’; that this catch up might include losing holiday time and/or spending longer days at school. I know my head would be hitting the table.
The small amount of extra funding allocated to schools, who will be accountable for ensuring students’ catch up’, appears to be a token gesture to show the government is doing something about education. In practice, what will this ‘catch up’ look like? My guess is a cycle of baseline assessments, targeted intervention, more assessments, updating spreadsheets, rinse and repeat.
Might it be better if we were to focus on rekindling a love of learning in our students, along with them experiencing the sense of success in education that comes with effective retrieval practice?
For ourselves, might it be better that we have the opportunity to hone our skills, to use the most effective teaching methods possible (including integrating some of the best of remote learning into our offer). We could sustainably improve the quality of teaching and learning, rather than everyone burning out ‘catching up’? We have an amazing opportunity to reflect on what works well for our students and embed effective practice to support future generations. Or, we could just ‘catch up’.
None of the above will be possible unless we trim down the curriculum to provide a level playing field. Without making changes to the curriculum, we will pile further pressure on students and teachers on the back of the pandemic’s untold impact. To plough through already content-heavy specifications/curriculums as well as catching up on ‘lost’ learning is a recipe for disaster.
The government must take proactive steps; otherwise, we subject students and teachers to time-heavy, reactionary interventions, all in the name of ‘catching up’.
Perhaps we need to draw a line in the sand and allow schools and students time to get back to normal (in addition to implementing Covid testing etc.). Perhaps the government could support students and schools by rationalising the curriculum over the medium term rather than dishing out nominal funds and expecting everyone to do even more to meet an arbitrary curriculum’s needs.
This would allow schools to identify students who have a genuine need for academic and mental health support. Specialist intervention can then be given to those that genuinely need it. This will help narrow the gap by elevating those that are underprivileged or are most in need of support.
We now have the opportunity to be proactive in improving the life chances of all students. Reactionary ‘catch up’ will be counter-productive for everyone involved.
Anthony
10 tools for home teaching

Anthony explores useful kit to support remote teaching and working from home.
Looking for tools to support home teaching? Since working on Internet Geography full-time, I’ve picked up some kit proven to be incredibly useful for home working. In the interest of being transparent, this post may contain affiliate links (at no extra cost to you).
Sit-Stand Desk
An electric, ergonomic height-adjustable sit-stand desk helps maximise the health benefits of alternating between standing and sitting while working. Long sitting hours on top of uncomfortable homeworking conditions can pose serious health risks such as high blood pressure, muscle loss and cardiovascular diseases. A sit-stand desk will help reduce your sitting hours and support you to work more efficiently.
Depending on your budget and resources, you’ve got the option to get a fully integrated frame and desk, or pick up a frame and attach a desktop of your own.
Desk frames start from around £179. The Flexispot EC1 is a single motor, heavy-duty steel desk to add your own desktop.
Monitor Stand
Raise your monitor to a comfortable, ergonomically correct height while maximising desk space with a monitor stand.
Monitor stands range from a simple adjustable desktop stand, such as the AmazonBasics adjustable stand to mounting solutions for one, two and three monitors.
Laptop Stand
Getting aches and pains from being hunched over your laptop? You might want to consider getting a laptop stand to raise your device to eye level. When combined with a Bluetooth mouse and keyboard, you can wave goodbye to aches and pains. I’ve got a VMEI laptop stand which I’ve been very impressed with.
Bluetooth Keyboard and Mouse
If you’re using a laptop as your primary device, you should really consider investing in a Bluetooth keyboard and mouse. A Bluetooth keyboard and mouse allows you to position yourself at a distance from your laptop or desktop, and generally have a much more flexible work area. If you are in the market for a Bluetooth keyboard and mouse you might want to consider the Logitech MK270 Wireless Keyboard and Mouse Combo. Combined with a VMEI laptop stand, the days of hunching over the laptop are over!
Headphones and Microphone
Unless you’re in a soundproof room, you are going to be competing with outside sounds. A quality headset will ensure you hear only what’s important – your students. Having had online meetings using both the mic and speakers on my laptop and Bluetooth headphones with in-built microphone, I have to say the headphones were much better. If you have the budget, then consider getting Apple AirPods. If you are looking for a cheaper solution, then the Mpow M30 wireless Earbuds are worth considering.
Second Monitor
There are many benefits to using multiple monitors, including enhanced productivity, better multitasking, easier cutting and pasting and displaying multiple windows at once. If you’re still using a single screen, you might want to consider moving to an additional screen (or two).
If you’ve already got a tablet that can be used as a second monitor, a gooseneck tablet holder, such as this one by Lamicall, is a great way to hold your tablet and give you the freedom to place it wherever it works for you.
If you are in the market for a cheap second monitor, it’s worth having a look on Facebook Marketplace. Alternatively, if you have a new monitor budget, I would recommend an HP 27f or BenQ GW2280.
Graphics Tablet
Graphics tablets are great for drawing diagrams, annotating images and providing feedback. My go-to graphics tablet is a Wacom Intuous. However, the cheaper XP-Pen G430S Graphics Tablet is worthy of your consideration.
Visualiser
Visualisers are cameras that can be attached to a computer and used to model answers etc. to students. The benefit of a visualiser is that once it’s set up, there’s no faffing around setting it up each time you want to use it as it’s plug and play. The Okiolabs Okiocam S is well worth considering if you are in the market for visualiser. Alternatively, if size is important the A3 Okiolabs Okiocam T version is also available.
Goose Neck Phone Holder
Not got the budget for a dedicated visualiser? Most smartphones can be used as a visualiser. A Lamical, gooseneck phone holder is a great way to suspend your phone while you model answers and geographical techniques live from your desk.
Desk Mat
Protect your desktop and reduce the noise of an external mouse by investing in a desk mat. I recommend this world desk mat by Jailong.
Ten Golden Rules for Tree-Planting
Scientists have proposed ten golden rules for tree-planting, which they believe is a top priority for all nations this decade.
Experts from the Royal Botanic Gardens, Kew say that planting trees is a brilliant solution to tackling climate change and protecting biodiversity; however, the wrong tree in the wrong place can cause more harm than good.
Forests are essential to life on Earth. Not only do they provide habitats to three-quarters of the world’s plants and animals, but they also offer food, fuels and medicines as well as soaking up carbon.
However, forests are disappearing at an alarming rate. An area of pristine tropical rainforest the size of Denmark is lost every year.
Reforestation, the restoration of forests that have recently been lost, could protect biodiversity and help fight global climate change by removing huge amounts of carbon dioxide from the atmosphere. There is a range of ambitious tree-planting projects happening around the world to replace lost forests.
The UK Government aims to plant 30,000 hectares (300 sq km) of new forest every year by the end of this parliament.
There is an ambitious project in Africa to grow a green wall of trees spanning 5000 miles (8,048km) across the entire continent, from east to west. The project, which will become the largest living structure on Earth, will help fight the climate crisis and combat desertification.
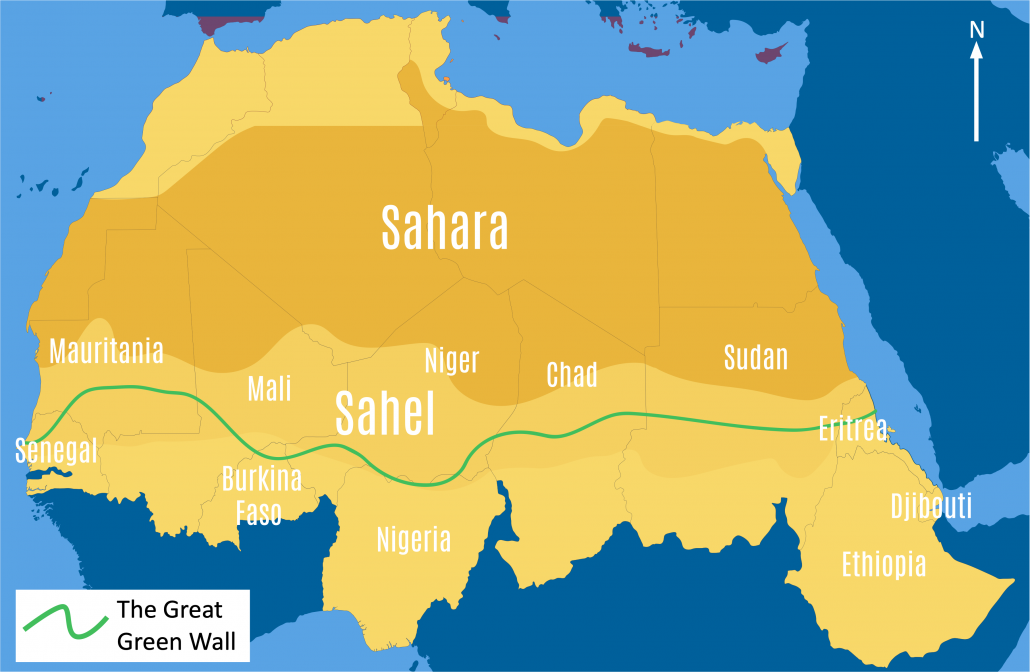
Planting trees is an essential solution to protecting biodiversity and combatting climate change. However, the process is surprisingly complex. The right trees have to be planted in the right place, if not it can cause more damage than food.
Natural forests, containing a wide range of plants, animals, and fungi, are often replaced by commercial plantations where trees are harvested after a few decades. Afforestation is more effective when people try to recreate forests similar to natural forests and provide benefits to people, the environment and nature, and capturing carbon.
A recent review led by Kew scientists and Botanic Gardens Conservation International (BGCI) proposes ‘ten golden rules for reforestation’ to boost benefits for people and the planet. The rules are:
- Protect existing forest first
- Work with local people
- Maximise biodiversity recovery to meet multiple goals
- Select the right area for reforestation
- Use natural forest regrowth wherever possible
- Select the right tree species that can maximise biodiversity
- Make sure the trees are resilient to adapt to a changing climate
- Plan ahead
- Learn by doing
- Make it pay
An overview of each rule is summarised in the diagram below.
Further details of each step are available on the Kew Gardens website.
Further reading
10 Golden rules for restoring forests – RBG Kew
Support for Geography in the News Assignment
Describe the distribution of forest change shown on the choropleth map
This question is asking you to describe the distribution (spread) of forest change shown on the choropleth (shading) map. As this is an interactive choropleth map you can click on the colours in the scale to highlight the patterns. Describing patterns on a choropleth map is easy using the TEA tool as it provides a structure to your answer. TEA stands for trend, examples and anomalies.
Trend
To begin with, it is useful to include an opening statement about the general distribution (pattern/spread) shown on the map. You could do this by asking yourself does the choropleth map show the global annual change in forest area in 2015 even or uneven?
Paragraph starter: The global annual change in forest area in 2015 is even/uneven.
Examples
Next, you need to discuss the patterns on the map giving examples. You could consider:
- What continents/countries are experiencing a decline in forest area?
- Are the countries mainly HICs, NEEs or LICs?
- Are they near the equator or further away?
- Are they inland or coastal?
- What continents/countries are experiencing an increase in forest area?
- Are the countries mainly HICs, NEEs or LICs?
- Are they near the equator or further away?
- Are they inland or coastal?
Anomalies
Finally, consider any patterns/examples that stand out. In this example, are there any HICs (wealthy countries) that are experiencing high levels of decline in forest cover – top tip – check out North America!)? Are there any LICs/NEEs that are experiencing high levels of forest cover increase (have a look at Asia!)?
Creating an exam paper in Microsoft Forms
Internet Geography Plus subscriptions have funded the development of these free resources. Please consider taking out a low-cost subscription to help us develop more content for Internet Geography.
Microsoft Forms quizzes are a simple and useful way for students to complete exam questions and papers. The benefit of using Microsoft Forms quizzes for exam questions is that it’s possible to automate some of the marking and feedback. In addition to this, marking is simplified because all the answers are in the same place, saving time when reviewing answers. Finally, Microsoft Forms provides an overview of performance that is useful for evaluating a group of students’ performance and identifying areas that need revisiting.
I’ve set up an example exam paper covering natural hazards using the 2018 AQA GCSE geography paper, which you can view and copy across to your Microsoft account by clicking the links below. The support videos below explain how the form was set up (video 1) and how Microsoft Forms can mark the paper, allocate scores, and provide personalised feedback (video 2).
If you’ve developed an exam paper in Microsoft Forms and are happy to share it with the wider community, please drop us an email.
Link 1: The exam paper how the students will see it
Link 2: Copy the exam paper over to your Microsoft Forms account (it is unlikely the images will copy across so you may need to add these yourself)
Video 1 – Setting up an exam paper in Microsoft Forms
Video 2 – Marking, allocating scores and providing feedback
Coming Soon
Video 3 – Review the performance and export to Excel
Coming soon!
Storm Christoph
Storm Christoph is the third named storm of the 2020/2021 season and the first of 2021, following Storm Aiden on October 30 and Storm Bella on Boxing Day 2020.
Storm Christoph was a slow-moving Atlantic depression, which brought a variety of weather to the UK between the 19th and 21st of January 2021. The storm system moved across the UK from west to east.
#StormChristoph comes in two main phases…
PHASE 1 – Tues to Thurs 💦
Heavy rain brings flooding N Eng & Midlands.PHASE 2 – Thurs ❄️💨
Heavy snow and stronger winds (blizzards) in Scot and N and NE Eng. pic.twitter.com/qtGSatxPVm— Simon King (@SimonOKing) January 19, 2021
Unlike the low-pressure systems that often affect the UK at this time of year, Storm Christoph’s main threat was heavy rainfall, rather than strong winds.
The map below shows flood warnings and the places with the most rainfall from Storm Christoph.
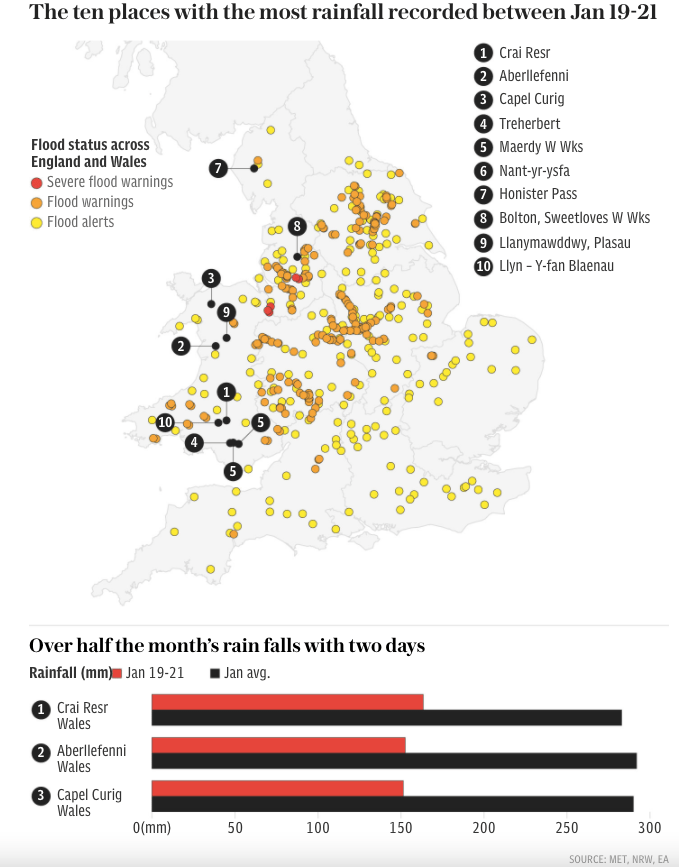
Storm Christoph rainfall and flood warnings – source
Preparation for Storm Christoph
An Amber National Severe Weather Warning for rain was issued for parts of northern and central England. Separate Yellow warnings for rain, wind, snow and ice covered large areas of England, Scotland, Wales and Northern Ireland.
The Environmental Agency and Met Office issued a series of warnings about Storm Christoph.
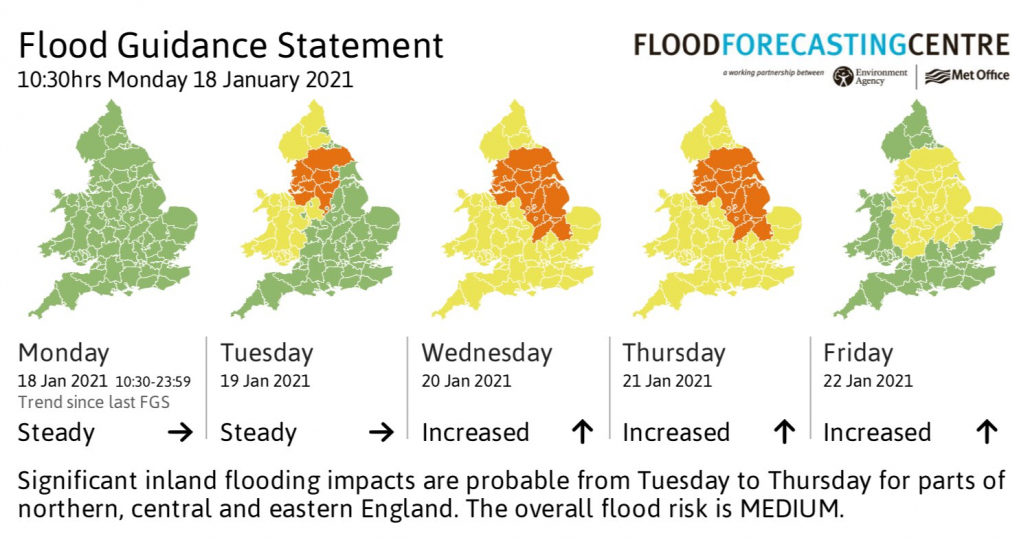
Flood Guidance Statement issued by the EA and Met Office
More than 400 flood warnings and alerts were issued across England. In Wales, 15 flood warnings and 53 flood alerts were in place.
The Prime Minister, Boris Johnson, advised people to act if instructed to evacuate.
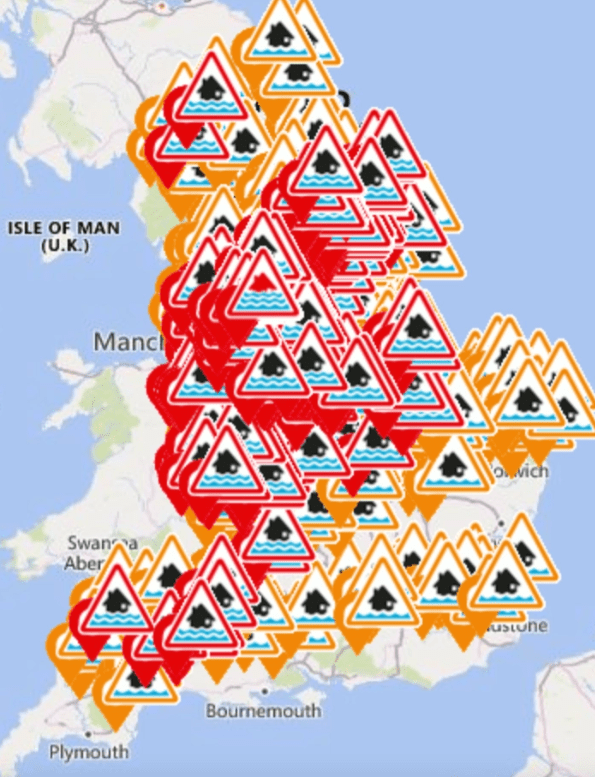
Storm Christoph flood warnings
Local authorities issued warnings to local residents.
Officers from Wigan Council, Greater Manchester Police, Greater Manchester Fire & Rescue Service and health services have worked together to respond to hundreds of calls and mitigated dozens of flooding incidents this week as a result of #StormChristoph pic.twitter.com/qiTSUCzOPx
— Wigan Council (@WiganCouncil) January 21, 2021
Several steps were taken to prepare areas previously affected by flooding. Fishlake, near Doncaster, was one of the worst affected areas in floods in November 2019. On Tuesday 19th January, residents readied themselves for their village to flood a second time in just over two years.
Many villagers had only been able to return to their homes for a matter of weeks, and some still haven’t managed to move back.
Doncaster Council said it had delivered 40,000 sandbags around the area since a flood alert was first issued.
Over 200 council staff in Fishlake joined with residents and volunteers to distribute sandbags days before Storm Christoph arrived, with each home receiving up to twenty.
A major incident was declared in South Yorkshire on Monday, with more than 40,000 sandbags distributed in flood-risk areas and a barrier built around a Covid vaccination centre in Mexborough.
In South Yorkshire, some roads were closed due to flooding, but no major incidents were reported. Flood wardens said improved flood defences and a changing forecast lessened the storm’s impact.
What were the effects of Storm Christoph?
Areas of the UK was hit by heavy rain, snow and flooding that has led to towns and villages being cut off and a major incident declared in South Yorkshire and Greater Manchester.
The northwest of England and the north of Wales were some of the worst affected areas as properties submerged as rivers burst their banks, and drainage systems failed to cope with the torrential downpours brought by Storm Christoph.
#StormChristoph is expected to bring up to 200mm of rain for parts of the UK this week. Stay in touch with the forecast here: https://t.co/iy7JDPLcWC pic.twitter.com/Bp4aKVCi9A
— BBC Weather (@bbcweather) January 18, 2021
The Cheshire village of Lymm, a village of 12,000 people located 7 miles away from Warrington, experienced flooding. However, this was not on the same scale as the floods of November 2019. Although fewer than a dozen homes were submerged in the end, for many of those, it was the second such disaster in less than two years.
Around 400 homes were flooded as a result of Storm Christoph, the Environment Agency has confirmed.
Around 26,000 homes were protected from the various flood defence assets distributed by the Environment Agency. 600 people were on the ground, putting up temporary barriers, using pumps in Manchester areas with particular flood challenges.
Firefighters and police evacuated 2,000 homes and businesses in south Manchester on January 20 with 3,000 properties said to be at risk.
Houses on Walmer Street in Abbey Hey, Manchester fell into a giant sinkhole following heavy rainfall.
In Maghull in Merseyside and Ruthin, North Wales, families were also forced out of their homes due to rising floodwaters.
Travel suspensions were placed on services from Carlisle to Skipton or Maryport, all destinations from Rotherham Central, and between Manchester and Newton le Willows.
Rail services between Warrington Central and Liverpool Lime Street, Altrincham to Chester, and Wigan to Southport were also suspended. Rail services between Leeds and York via Garforth were disrupted due to flooding in the Garforth area, with bus services replacing trains throughout the day.
In South Wales, water built up in a mine shaft causing a “blow out” that flooded properties in Skewen, Neath Port Talbot. At least 80 people had to leave their homes in the village after flooding.
North Yorkshire County Council said more than 15,000 sandbags were at the ready around the county.
Flood plains near Cawood in North Yorkshire, have been storing vast amounts of water as rivers rose rapidly following Storm Christoph’s heavy rainfall. These are shown in the video below.
A Covid-19 testing centre at Meadowhall in Sheffield was closed until Friday 22nd January due to the risk of flooding.
As water moves through drainage basins, monitoring is ongoing in low-lying areas.
Insurance losses from Storm Christoph are predicted to be between £80million and £120million.


