
You are here: GCSE Geography Interactive Revision > Statistics in Geography > Range Practice Questions
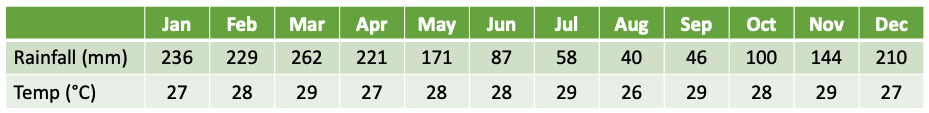
Study the table showing climate data for the Amazon Rainforest. What is the rainfall range for the Amazon?
Correct!
Wrong!
Study the table showing climate data for the Amazon Rainforest. What is the temperature range for the Amazon?
Correct!
Wrong!
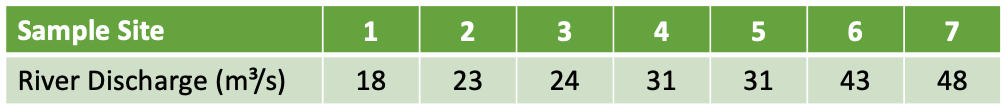
Study the river discharge data below. What is the river discharge range?
Correct!
Wrong!
Study the data below which shows average annual rainfall for the UK between 2010 and 2020. Calculate the rainfall range.

Correct!
Wrong!
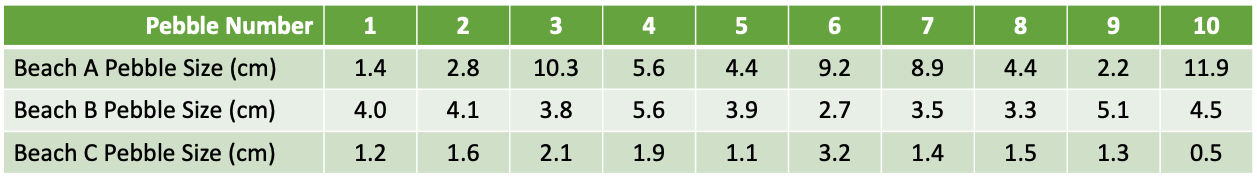
A student has collected pebble size data as part of an investigation comparing three beaches. The student randomly measured the long axis of 11 pebbles at three beaches. Study the results below. Calculate the pebble size range for beach B.
Correct!
Wrong!
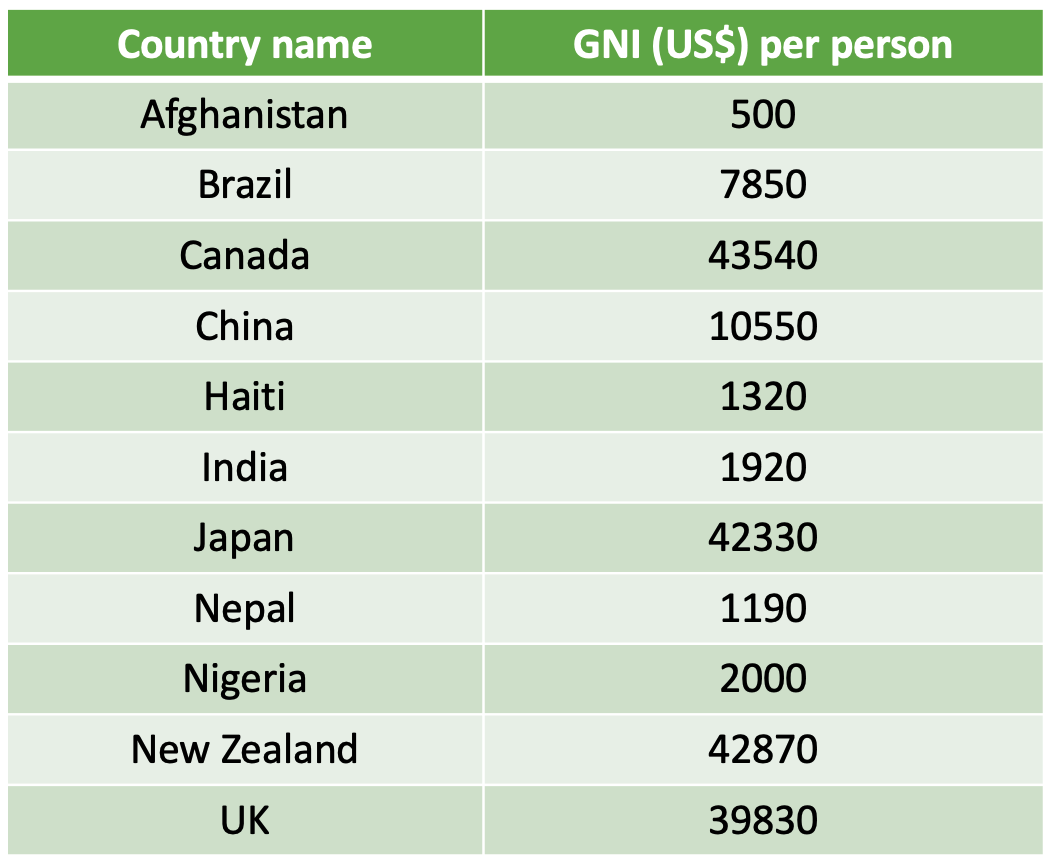
The data below shows the Gross National Income (GNI) data for selected countries in 2020. Calculate the range for the GNI data in the table.
Correct!
Wrong!
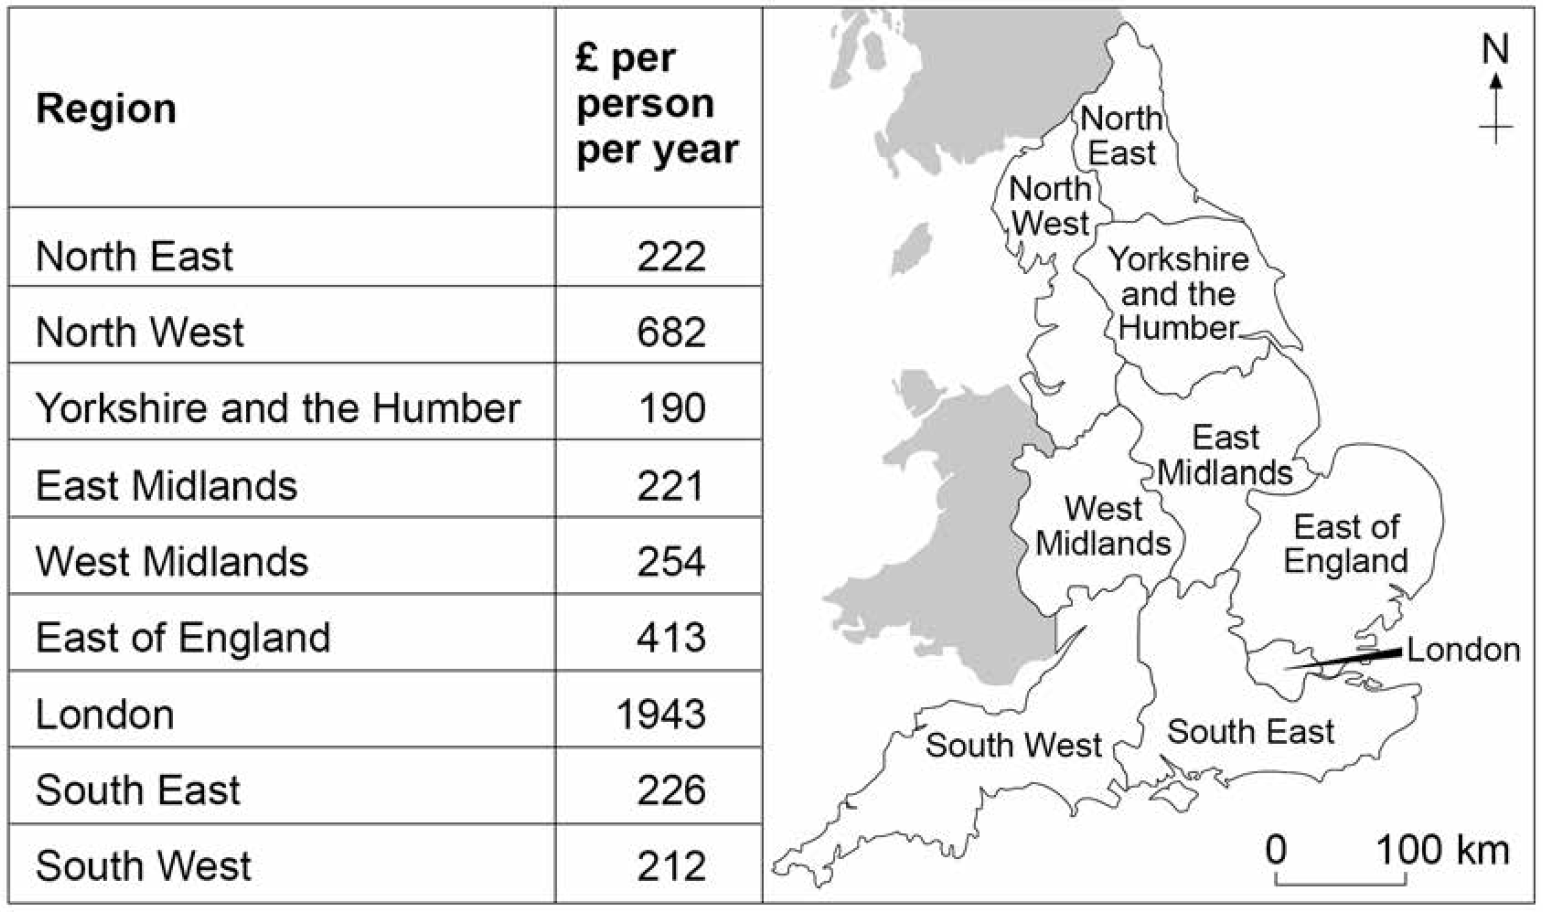
The table below shows information about the planned spending on transport infrastructure in England’s regions 2016–2021. Calculate the range for the data below.
Correct!
Wrong!
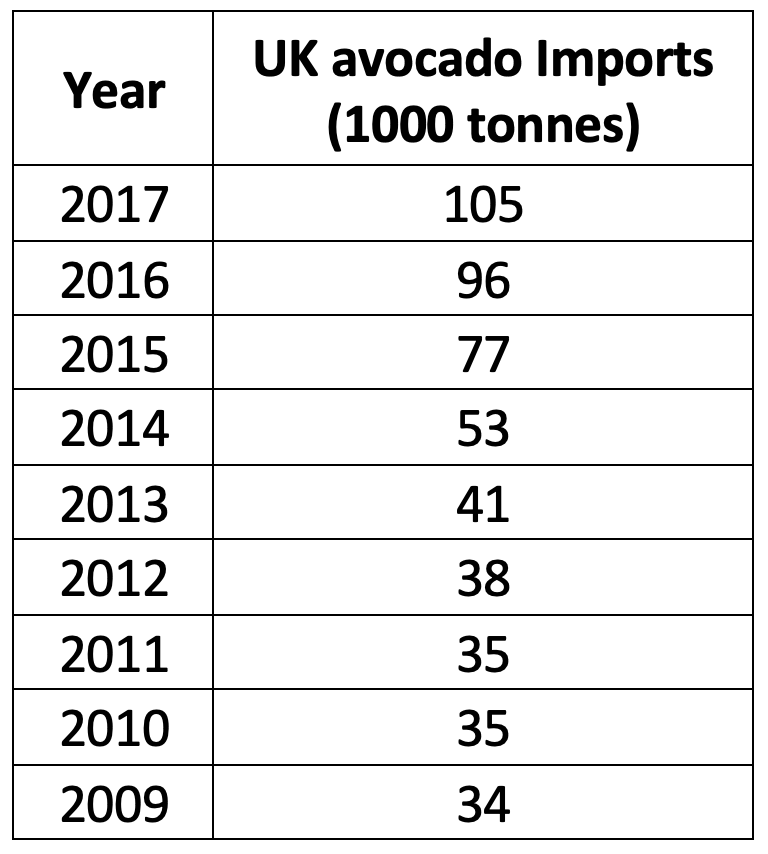
The table below shows UK annual avocado imports. Study the table below showing avocado imports into the UK, 200–2017. Calculate the range for the data below.
Correct!
Wrong!
Top Pages
Blog Posts
 Introduction to the AQA GCSE Geography Pre-release 20256 March 2025 - 11:38 am
- Santorini Shaken by Earthquake Swarm: Thousands Evacuate Amid Safety Fears6 February 2025 - 12:54 pm
- AQA GCSE Geography Case Studies and Examples Sheet22 January 2025 - 12:24 am
- GCSE Geography Summary Knowledge Organisers18 January 2025 - 11:32 am
- Wildfires in California: Causes, Effects, and Responses13 January 2025 - 11:46 am
- 2024: A Record Year for Wind Power10 January 2025 - 12:53 pm