Graphic Organisers
Effective revision involves you being active, not just reading your notes or highlighting text (these two techniques have a very low impact on your learning and retention). Graphic organisers are a useful way of revising as they involve you making meaningful links and connections.
What are the different graphic organisers that can be used in geography revision?
- Ranking ladder
The ranking ladder can be used to prioritise or rank ideas and information. It can also be used for topics with a series of stages or steps. It is suitable when there is a clear beginning and end.How can I use this in geography?
The formation of an oxbow lake, changes in the course of a river from source to mouth, the erosion of a headland, a natural hazard case study, the formation of a waterfall, the water cycle. - Venn diagram
The double Venn is a simple and highly effective model for examining the similarities and differences between two items. It is also easy to extend the Venn diagram to three features.How can I use this in geography?
Economic/social effects of natural hazards, features of coastal erosion, social/economic/environmental impacts of deforestation/desertification. - Sequence chart
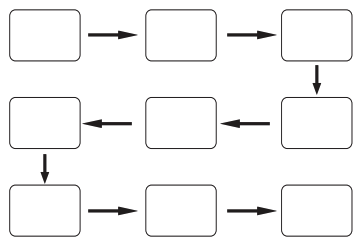
When a topic involves a sequence of events this organiser can be helpful. It is particularly useful when processes/formations need to be put in order and remembered.
Sequence chart
How can I use this in geography?
Rock cycle, water cycle, formation of a river/coastal/glacial feature, weathering – freeze-thaw action, mass movement, economic decline. - Decision matrix
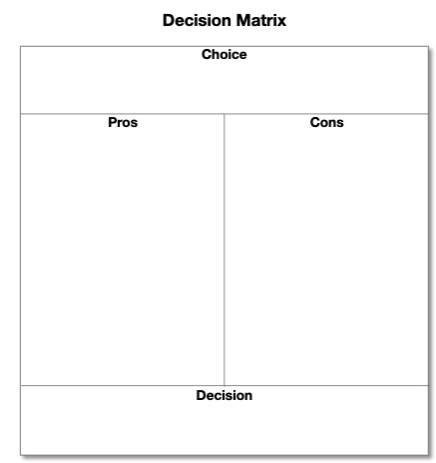
A decision matrix can be used to identify a choice, its advantages and disadvantages, and a decision.
Decision matrix
How can I use this in geography?
Reviewing the impact of a management strategy e.g. coastal defences/rainforest management/urban redevelopment/impacts of tourism/decision-making exercise. - Fishbone
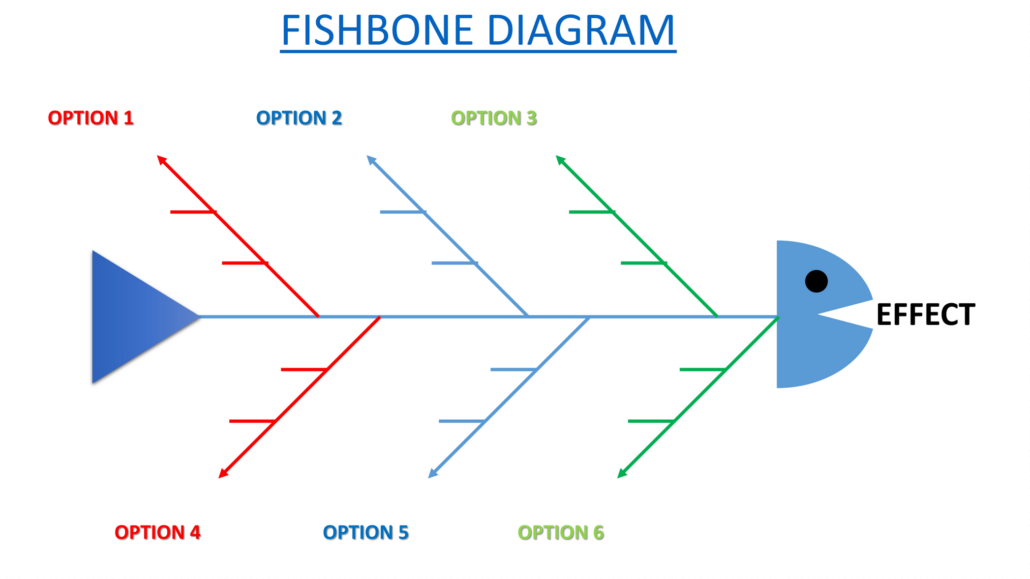
Fishbone diagrams allow you to explore many aspects or effects of a complex topic, helping you to organise your thoughts in a simple, visual way.How can I use this in geography?
Fishbone diagrams are ideal for summarising the key aspects of a topic. They can also be used to identify cause and effect. - Multiple causes and effects
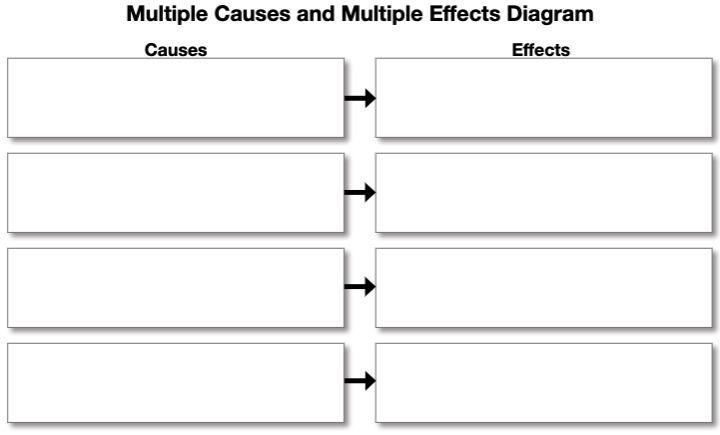
You can use a multiple causes and multiple effects diagram to identify what happened (effects) and why it happened (causes).
Multiple causes and multiple effects diagram
How can I use this in geography?
Processes of erosion, mass movement, migration. - Multiple causes and one effect
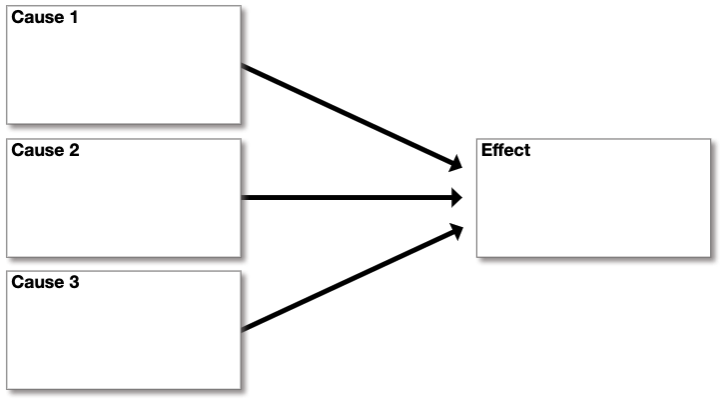
You can use a multiple causes and one effect diagram to identify what happened (effect) and why it happened (causes).
Multiple causes and one effect
How can I use this in geography?
Causes of climate change, deforestation, migration. - One cause multiple effects
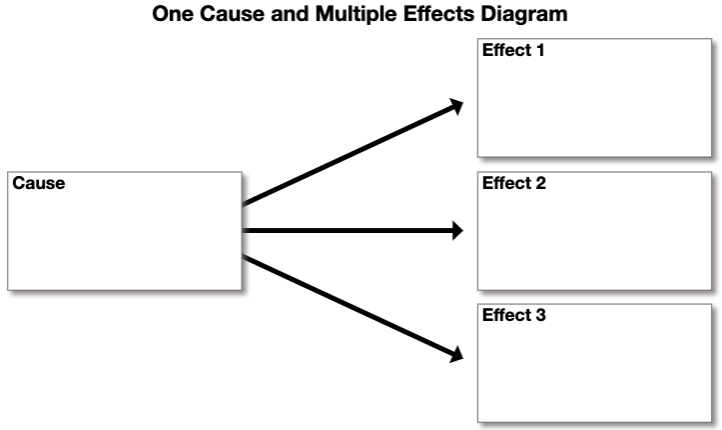
You can use a one cause and multiple effects diagram to identify one cause and the multiple effects of the cause.
One cause multiple effects
How can I use this in geography?
Deforestation, management schemes. - Five Ws chart
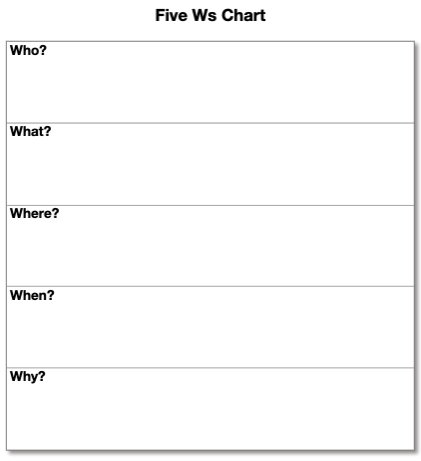
You can use a 5 Ws chart to identify who, what, where, when, and why. You can also throw in So what, to assess impacts.
Five Ws
How can I use this in geography?
Case studies - Classification chart
You can use a classification chart to classify, categorize, or sort information.
Classification chart
How can I use this in geography?
Development indicators, processes e.g. erosion, transportation and deposition.
Moving forward
Attempt to use a range of methods above. Review the degree to which they help with your learning/revision.
Revision
Further Revision Resources

